Capital Asset Pricing Model (CAPM): Decoding the Theory Behind Stock Prices
Unlock the secrets of stock market valuation with the Capital Asset Pricing Model (CAPM). This in-depth guide explains how CAPM helps investors assess risk, calculate expected returns, and make informed decisions in the Indian stock market.

Understanding the Enigma of Stock Market Valuation
The Indian stock market, a microcosm of the nation's vibrant economy, is a fascinating yet often baffling arena. Share prices, akin to the moods of a passionate crowd, swing dramatically, sometimes within a single trading session. These fluctuations can be triggered by a myriad of factors, both rational and emotional. Company earnings reports, economic indicators, global events, even the whispers of market sentiment can send ripples through the indices, causing share prices to soar or plummet.
This apparent chaos can leave even seasoned investors scratching their heads. Is there any rhyme or reason to these movements? Can one truly predict the trajectory of a stock's price? Beneath this surface turbulence, financial theorists have sought to identify underlying principles that govern stock valuation. And while the market may never be fully tamed, one model has emerged as a cornerstone in understanding the relationship between risk and return: the Capital Asset Pricing Model (CAPM).
Think of CAPM as a compass in the vast wilderness of the stock market. It doesn't claim to pinpoint the exact location of hidden treasure (the perfectly valued stock), but it does provide a bearing, a directional guide. It helps investors understand why some stocks are considered more valuable than others, and what level of return they should reasonably expect for the risks they undertake.
CAPM acknowledges that investors are inherently risk-averse. They demand a premium for holding assets that carry higher risk. This risk premium is the crux of the model. CAPM quantifies this premium, offering a framework for calculating the expected return of a particular stock based on its risk profile relative to the overall market.
By understanding CAPM, investors gain a powerful tool for navigating the complexities of the stock market. They can make more informed decisions about which stocks to buy, hold, or sell. They can build diversified portfolios that balance risk and return. They can even evaluate the performance of their investments against a theoretical benchmark.
In essence, CAPM provides a glimpse into the underlying logic of stock valuation. It doesn't eliminate the uncertainties of the market, but it helps investors make sense of the apparent chaos, transforming the enigma into a calculated risk.
The Essence of CAPM
At its core, the Capital Asset Pricing Model (CAPM) is a cornerstone of modern financial theory. It's a model that strives to answer a fundamental question for investors: "What return should I expect for investing in this particular stock?"
The answer, according to CAPM, lies not merely in the potential gains a stock might offer, but in the risks it entails. In the world of investing, there's no free lunch. Higher potential returns usually come hand in hand with higher risks. CAPM provides a structured way to quantify this risk-return tradeoff.
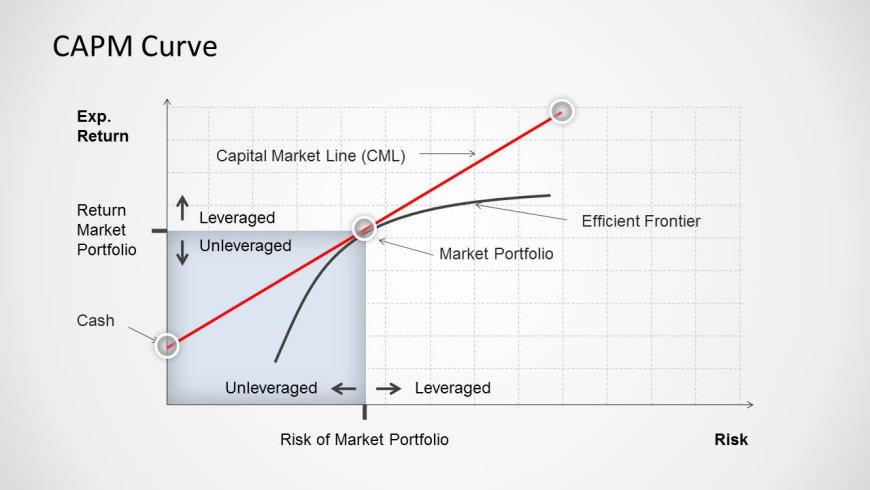
Imagine a scale where risk is on one side and return is on the other. CAPM helps us understand where a particular stock sits on that scale. It tells us how much extra return – the "risk premium" – investors should demand to compensate for taking on the risk of investing in that stock rather than a safer alternative like a government bond.
The key insight of CAPM is that not all stocks are created equal when it comes to risk. Some stocks, often those in volatile industries or with uncertain futures, are inherently riskier than others. CAPM captures this variation in risk through a metric called "beta." A stock's beta measures how sensitive its price is to movements in the overall market. A high-beta stock is like a roller coaster – it tends to exaggerate the market's ups and downs, offering the potential for both greater gains and greater losses.
CAPM then translates this risk, as measured by beta, into a corresponding expected return. It essentially says, "If you're going to invest in a riskier stock, you deserve a higher expected return to compensate you for that risk." Conversely, if a stock is less risky, investors should be content with a lower expected return.
In this way, CAPM provides a rational framework for evaluating investment opportunities. It doesn't guarantee that a stock will meet its expected return – markets are far too complex for that – but it offers a benchmark for assessing whether a stock's potential rewards are commensurate with the risks involved. By quantifying the relationship between risk and return, CAPM empowers investors to make more informed and calculated decisions in the dynamic and often unpredictable Indian stock market.
Key Components of CAPM
1. Risk-Free Rate (Rf):
-
The Foundation of Expected Returns: The risk-free rate acts as the bedrock upon which all other returns in CAPM are built. It represents the minimum return an investor should expect, even if they take absolutely no risk. This is the return they could achieve by investing in a virtually riskless asset.
-
Government Securities as a Proxy: In India, government securities, particularly those issued by the central government, are often used as a proxy for the risk-free rate. These bonds are considered safe because the Indian government has a very low probability of defaulting on its debt obligations. The yield on these government bonds, which varies over time, serves as a practical reference point for the risk-free rate in CAPM calculations.
2. Beta (β):
-
The Measure of Market Sensitivity: Beta is the heart of CAPM's risk assessment. It quantifies how closely a particular stock's price movements mirror those of the broader market. Think of it as a measure of a stock's "market sensitivity."
-
Interpreting Beta Values:
- Beta = 1: A stock with a beta of 1 means it tends to move in lockstep with the market. If the market goes up 10%, this stock is also expected to rise by roughly 10%.
- Beta > 1: A beta greater than 1 indicates the stock is more volatile than the market. It will amplify the market's movements – rising or falling more sharply.
- Beta < 1: A beta less than 1 means the stock is less volatile than the market. It tends to move more moderately, offering a smoother ride for investors.
-
Finding Beta Values: Beta values for Indian stocks are often available from financial websites or research reports. They are calculated based on historical price data, comparing the stock's performance to a benchmark index like the Nifty 50.
3. Market Risk Premium (Rm - Rf):
-
The Reward for Risk-Taking: The market risk premium represents the extra return that investors expect to earn for taking on the additional risk of investing in the overall stock market instead of sticking with the safety of risk-free assets.
-
Reflecting Market Sentiment: The market risk premium is not a fixed number. It fluctuates based on a variety of factors, including economic conditions, investor sentiment, and perceived market risks. In India, factors like political stability, regulatory changes, and monsoon patterns can all influence the market risk premium.
-
Estimating the Market Risk Premium: There are different approaches to estimating the market risk premium. One common method involves looking at historical returns of the market (e.g., the Nifty 50) and subtracting the risk-free rate. However, it's important to note that historical data may not always be a reliable predictor of future market behavior.
Understanding these three key components is essential for applying CAPM effectively in the Indian stock market. They provide the building blocks for calculating expected returns, assessing risk profiles, and making informed investment decisions.
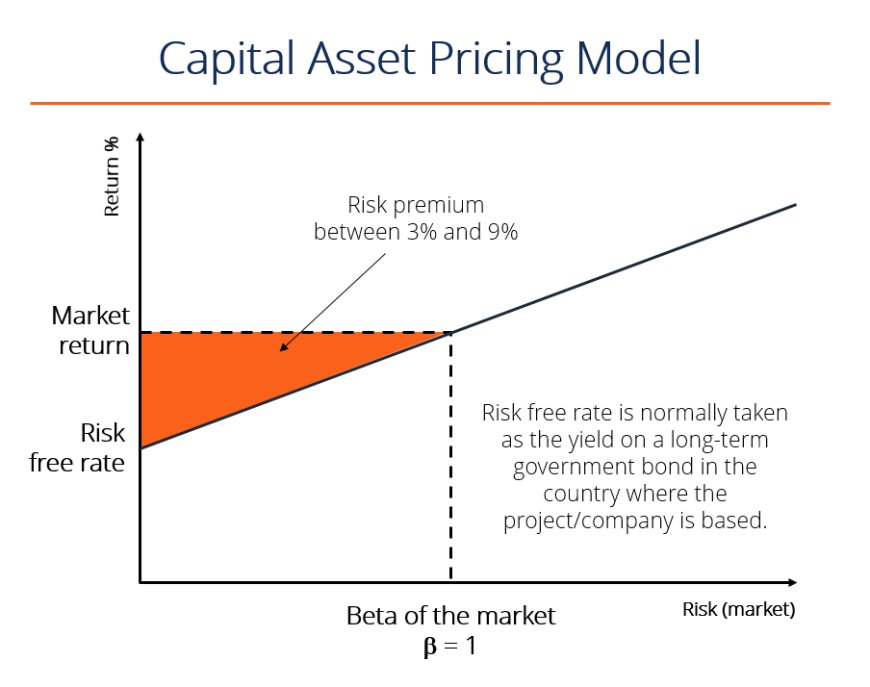
The CAPM Formula: Unveiling the Mechanics
The Capital Asset Pricing Model (CAPM) is elegantly encapsulated in a concise formula:
Expected Return = Risk-Free Rate + Beta * Market Risk Premium
While seemingly simple, this formula holds profound implications for understanding the relationship between risk and return in the stock market. Let's dissect its components:
-
Expected Return: This is the return an investor anticipates receiving from holding a specific stock. It's a forward-looking estimate, not a guarantee. The CAPM formula provides a framework for calculating this expected return based on a stock's risk profile.
-
Risk-Free Rate (Rf): As discussed earlier, this is the return an investor could earn from a virtually riskless investment, typically represented by the yield on government bonds. It serves as the baseline for expected returns in the CAPM model.
-
Beta (β): Beta quantifies a stock's volatility relative to the broader market. It's a measure of the stock's sensitivity to market movements. A higher beta means greater volatility and, theoretically, a higher expected return to compensate for that increased risk.
-
Market Risk Premium (Rm - Rf): This is the additional return investors demand for investing in the overall market (Rm) instead of a risk-free asset (Rf). It's a reflection of the market's overall risk appetite and varies over time based on economic conditions and investor sentiment.
The Logic Behind the Formula
The CAPM formula can be interpreted as follows:
-
The Risk-Free Rate: This is the bare minimum return investors expect, regardless of the stock they choose. It's the compensation they receive simply for delaying consumption and investing their money.
-
Beta * Market Risk Premium: This part of the formula accounts for the additional risk an investor takes on by choosing a specific stock rather than a risk-free asset. The beta acts as a multiplier, adjusting the market risk premium based on the stock's individual volatility.
- If a stock has a beta greater than 1 (more volatile than the market), the market risk premium is amplified, resulting in a higher expected return.
- If a stock has a beta less than 1 (less volatile than the market), the market risk premium is reduced, leading to a lower expected return.
-
The Sum of the Parts: The expected return of a stock is the sum of these two components: the risk-free rate plus the risk premium adjusted by beta. This reflects the idea that investors should be compensated for both the time value of money (risk-free rate) and the specific risk associated with the stock they choose.
Important Considerations
While the CAPM formula provides a valuable framework for understanding expected returns, it's crucial to remember that it's a model based on certain assumptions. Real-world markets are complex and influenced by numerous factors beyond those captured in the CAPM. Therefore, the expected return calculated using CAPM should be viewed as a guide rather than an absolute prediction.
Illustrative Example: Reliance Industries in the CAPM Spotlight
Imagine yourself as an investor in the Indian stock market, eyeing Reliance Industries Limited (RIL) as a potential addition to your portfolio. To make an informed decision, you turn to the Capital Asset Pricing Model (CAPM) to assess the expected return you should demand for holding RIL shares.
Scenario:
- Risk-Free Rate (Rf): 6% (This could represent the yield on a 10-year Indian government bond.)
- Market Risk Premium (Rm - Rf): 8% (This reflects the additional return investors expect for investing in the broader Indian market, as represented by an index like the Nifty 50, compared to the risk-free rate.)
- Beta (β) of Reliance Industries: 1.2 (This indicates that RIL is 20% more volatile than the overall market. If the market rises or falls by 10%, RIL's stock price would be expected to change by approximately 12%.)
Applying the CAPM Formula:
Expected Return (Reliance) = Risk-Free Rate + Beta * Market Risk Premium
Expected Return (Reliance) = 6% + 1.2 * 8%
Expected Return (Reliance) = 15.6%
Interpretation:
The CAPM calculation suggests that, based on its risk profile, you should expect a 15.6% annual return from investing in Reliance Industries. This expected return comprises two parts:
-
Compensation for Time: The 6% risk-free rate compensates you for the time value of money – for tying up your capital in an investment rather than spending it immediately.
-
Compensation for Risk: The remaining 9.6% (1.2 * 8%) is the risk premium. It reflects the additional return you expect to receive because RIL is a riskier investment than a government bond. Since RIL has a beta greater than 1, it's expected to be more volatile than the market, and therefore, you demand a higher return to compensate for that volatility.
Decision Time:
Armed with this information, you can now compare the expected return of 15.6% with your own investment goals and risk tolerance. If you believe RIL's potential return justifies the associated risk, you might consider adding it to your portfolio. However, if you find the risk too high or the expected return insufficient, you might look for alternative investments with a different risk-return profile.
Practical Applications of CAPM in the Indian Context
1. Investment Decision-Making:
-
Identifying Undervalued Stocks: CAPM allows investors to compare the expected returns of different stocks based on their risk profiles. By calculating the expected return using CAPM and comparing it to a stock's current market price, investors can identify potentially undervalued stocks. These are stocks that may be trading at a price lower than their theoretical value, suggesting the potential for higher-than-average returns in the future.
-
Risk-Return Tradeoff: CAPM helps investors understand the tradeoff between risk and return. For example, a high-beta stock like a technology company might offer a higher expected return than a low-beta stock like a consumer staples company. This information empowers investors to choose stocks that align with their individual risk tolerance and investment objectives.
2. Portfolio Construction:
-
Diversification: CAPM emphasizes the importance of diversification in managing risk. By selecting stocks with varying betas, investors can create a portfolio that is not overly exposed to the volatility of a single stock or sector. This can help mitigate risk and smooth out returns over time.
-
Balancing Risk and Return: CAPM can be used to construct portfolios that target specific risk-return profiles. For instance, an investor seeking higher returns might include a higher proportion of high-beta stocks, while a more conservative investor might favor low-beta stocks for stability.
3. Performance Evaluation:
-
Benchmarking: CAPM provides a benchmark for evaluating the performance of individual stocks and investment portfolios. If a stock consistently outperforms its expected return based on CAPM, it may suggest that the company is managed well or that the market is undervaluing it. Conversely, underperformance relative to CAPM might raise red flags.
-
Evaluating Portfolio Managers: CAPM is often used to assess the performance of portfolio managers. By comparing a portfolio's actual returns to its expected return based on CAPM, investors can gauge whether the manager is adding value through their investment decisions.
Additional Considerations in the Indian Context:
While CAPM is a valuable tool, it's important to recognize that the Indian stock market has unique characteristics that may require additional considerations:
-
Regulatory Changes: The Indian regulatory environment can be dynamic, with frequent changes in policies and regulations. These changes can introduce unexpected risks or opportunities that CAPM may not fully capture.
-
Macroeconomic Factors: India's economy is influenced by a variety of factors, including monsoon patterns, global commodity prices, and geopolitical events. These factors can impact the market risk premium and the performance of individual stocks, requiring investors to adjust their CAPM calculations accordingly.
-
Investor Sentiment: Indian investors are often influenced by market sentiment and herd behavior. This can lead to temporary deviations from CAPM's predictions.
CAPM is a powerful tool for Indian investors, but it should be used in conjunction with a thorough understanding of the Indian economic landscape and market dynamics. By combining CAPM with other analytical tools and staying informed about market developments, investors can make more informed decisions and navigate the complexities of the Indian stock market with greater confidence.
Limitations and Criticisms of CAPM: A Closer Look
While CAPM is undoubtedly a valuable tool for understanding the relationship between risk and return, it's important to be aware of its limitations and the criticisms it has faced:
1. Simplified Assumptions:
-
Rationality: CAPM assumes that all investors are perfectly rational and make decisions based solely on maximizing their expected returns while minimizing risk. In reality, investor behavior is often driven by emotions like fear and greed, leading to irrational decisions.
-
Risk Aversion: The model assumes all investors are risk-averse, meaning they dislike risk and demand higher returns for taking on more risk. However, some investors are risk-seeking and may be willing to accept lower returns for the chance of higher gains.
-
Homogeneous Expectations: CAPM assumes that all investors have access to the same information and share the same expectations about future market returns and risks. In practice, information asymmetry exists, and investors have varying opinions and forecasts.
2. Historical Data Reliance:
-
Beta Estimation: CAPM relies heavily on historical data to estimate a stock's beta, a measure of its volatility relative to the market. However, past performance is not always indicative of future results. Market conditions can change rapidly, and a stock's historical beta may not accurately reflect its future risk profile.
-
Changing Market Dynamics: The Indian stock market is influenced by various factors, including regulatory changes, economic policies, and global events. These factors can alter market dynamics and make historical data less relevant for predicting future returns.
3. Single Factor Model:
-
Ignoring Unsystematic Risk: CAPM focuses solely on systematic risk (market risk) and ignores unsystematic risk (company-specific risk). In reality, factors like a company's management quality, financial health, and industry trends can significantly impact its stock price, even if the overall market is performing well.
-
Multi-Factor Models: Alternative models like the Fama-French Three-Factor Model and the Arbitrage Pricing Theory (APT) have been developed to address this limitation by incorporating additional factors like company size, value, and momentum into the calculation of expected returns.
Additional Criticisms:
-
Difficulty in Estimating the Market Risk Premium: The market risk premium, a crucial component of CAPM, is notoriously difficult to estimate accurately. Different methods can yield varying results, leading to uncertainty in CAPM calculations.
-
Lack of Empirical Evidence: Some studies have found that CAPM does not always accurately predict stock returns in real-world markets. This has led to debates about the model's validity and usefulness.
While CAPM has its limitations, it remains a valuable tool for investors. It provides a framework for understanding the relationship between risk and return, and it can be used in conjunction with other analytical tools and a thorough understanding of market conditions to make informed investment decisions.
Conclusion: CAPM as a Compass in the Indian Stock Market
The Capital Asset Pricing Model (CAPM) stands as a beacon of financial theory, illuminating the intricate relationship between risk and return that lies at the heart of the stock market. In the dynamic and often unpredictable landscape of the Indian stock market, CAPM serves as a valuable compass, guiding investors through the complexities of valuation and decision-making.
CAPM empowers investors with a structured framework for assessing the expected returns of individual stocks, taking into account their inherent risk profiles. By understanding the interplay between the risk-free rate, beta, and the market risk premium, investors can make more informed choices about which stocks to include in their portfolios. They can identify potentially undervalued stocks, build diversified portfolios that balance risk and return, and evaluate the performance of their investments against a theoretical benchmark.
However, as with any model, CAPM is not without its limitations. Its reliance on simplified assumptions, historical data, and a single risk factor may not fully capture the complexities of real-world markets. Moreover, the unique characteristics of the Indian market, such as regulatory changes, macroeconomic volatility, and investor sentiment, necessitate additional considerations beyond the CAPM framework.
Therefore, while CAPM is a powerful tool, it should not be the sole determinant of investment decisions. Savvy investors in India would do well to combine CAPM insights with other analytical tools, fundamental analysis, and a deep understanding of the Indian economic landscape.
By recognizing CAPM's strengths and limitations, and by adapting its principles to the specific context of the Indian market, investors can enhance their decision-making processes and navigate the turbulent waters of the stock market with greater confidence and clarity. While CAPM may not offer a crystal ball for predicting the future, it does provide a valuable lens through which to view the intricate dance of risk and return that unfolds in the Indian stock market.
Disclaimer:
The information presented in this article about the Capital Asset Pricing Model (CAPM) is for educational and informational purposes only. It should not be considered as financial advice. Investing in the stock market involves risk, and past performance is not indicative of future results. The CAPM is a theoretical model, and its assumptions may not always hold true in real-world market conditions.
Before making any investment decisions, please conduct thorough research, consult with a qualified financial advisor, and consider your own risk tolerance and investment objectives. The author and publisher of this article are not responsible for any losses or damages incurred as a result of reliance on the information provided herein.
What's Your Reaction?


