


Technical Analysis 101: Using Charts to Decode Profitable Trades in the Indian Market
This article is a comprehensive guide to technical analysis, tailored specifically for Indian traders and investors. It covers the basics of technical analysis, essential charting tools, key technical indicators, common chart patterns, and practical tips for applying these concepts in the Indian market. Whether you're a beginner or an experienced trader, this article provides valuable insights to help you make informed decisions and navigate the dynamic Indian stock market with confidence.
The Indian stock market, with its vibrant mix of blue-chip companies, emerging sectors, and mid-cap gems, presents a world of opportunities for investors. However, navigating this dynamic landscape requires more than just intuition. Enter technical analysis – a powerful toolkit that uses charts, patterns, and indicators to predict future price movements. This article will serve as your comprehensive guide to technical analysis, specifically tailored for the Indian market.
Understanding Technical Analysis: The Basics
Technical analysis is a method of evaluating securities, such as stocks, commodities, or currencies, by studying their past market data, primarily price and volume. Technical analysts, often called "chartists," believe that historical price and volume data can reveal valuable insights into future price movements. This is based on the idea that markets are driven by the collective psychology of traders and investors, and this psychology tends to repeat itself in recognizable patterns.
The Philosophy of Technical Analysis
- Market Price Discounts Everything: Technical analysts believe that the current market price of a security already reflects all known fundamental factors, such as a company's financial performance, industry trends, and economic outlook. Therefore, they focus on analyzing price action itself rather than external factors.
- Price Moves in Trends: Technical analysis operates on the premise that prices tend to move in trends. These trends can be short-term, medium-term, or long-term, and they can persist for extended periods. Identifying and understanding these trends is a key goal of technical analysis.
- History Repeats Itself: Technical analysts believe that certain patterns in price charts tend to repeat themselves over time. This is attributed to the consistent human behavior that drives market psychology. By recognizing these repeating patterns, analysts can potentially predict future price movements.
How Technical Analysis Differs from Fundamental Analysis
Technical analysis and fundamental analysis are two distinct approaches to evaluating securities:
- Fundamental Analysis: Focuses on evaluating a company's financial health, analyzing factors such as earnings, revenue, assets, liabilities, management, and industry trends. The goal is to determine the intrinsic value of a security.
- Technical Analysis: Focuses on analyzing market data, primarily price and volume. It ignores fundamental factors and instead looks for patterns, trends, and signals in the price chart. The goal is to predict future price movements based on historical data.
Why Technical Analysis is Popular in India
Technical analysis is a widely used tool in the Indian stock market for several reasons:
- Accessibility: It doesn't require in-depth knowledge of financial statements or accounting principles. Anyone with access to price charts and some basic understanding of technical tools can use it.
- Time Efficiency: Technical analysis can be applied to short-term, medium-term, and long-term trading, making it versatile for different investment styles.
- Objectivity: It relies on historical data and mathematical calculations, which can be less subjective than fundamental analysis.
- Wide Applicability: It can be used to analyze various financial instruments, including stocks, commodities, currencies, and derivatives.
Why Technical Analysis Matters in the Indian Market
The Indian stock market, much like any other, is subject to the laws of supply and demand, investor sentiment, and global economic trends. Technical analysis provides a structured way to interpret these factors and their impact on stock prices. By recognizing patterns and trends in historical data, traders and investors can make informed decisions about buying, selling, or holding securities.
Essential Charting Tools for Technical Analysis
Technical analysis heavily relies on visual representations of price data, and various chart types serve different purposes in aiding traders' decision-making. Here's a closer look at the essential charting tools:
1. Line Charts:
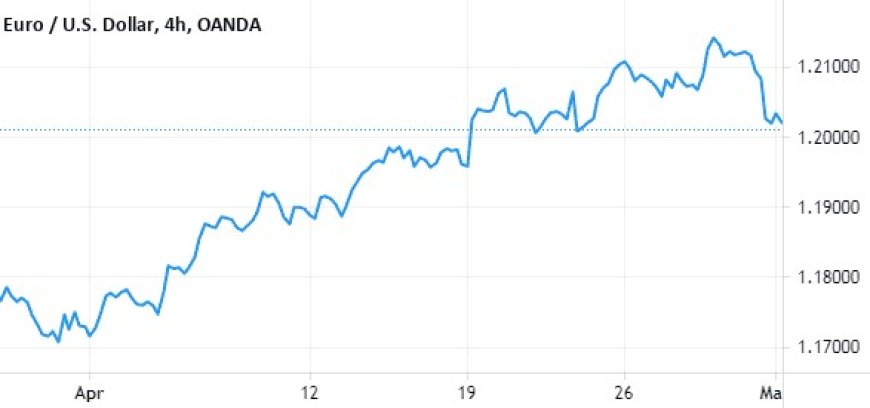
- Simplicity: Line charts are the simplest form of charting, connecting the closing prices of a security over a specific period.
- Quick Overview: They provide a smooth, continuous line that offers a quick and easy overview of a security's overall price trend.
- Best Suited For: Line charts are ideal for identifying long-term trends and getting a general sense of a security's price history. However, they lack the detailed information provided by other chart types.
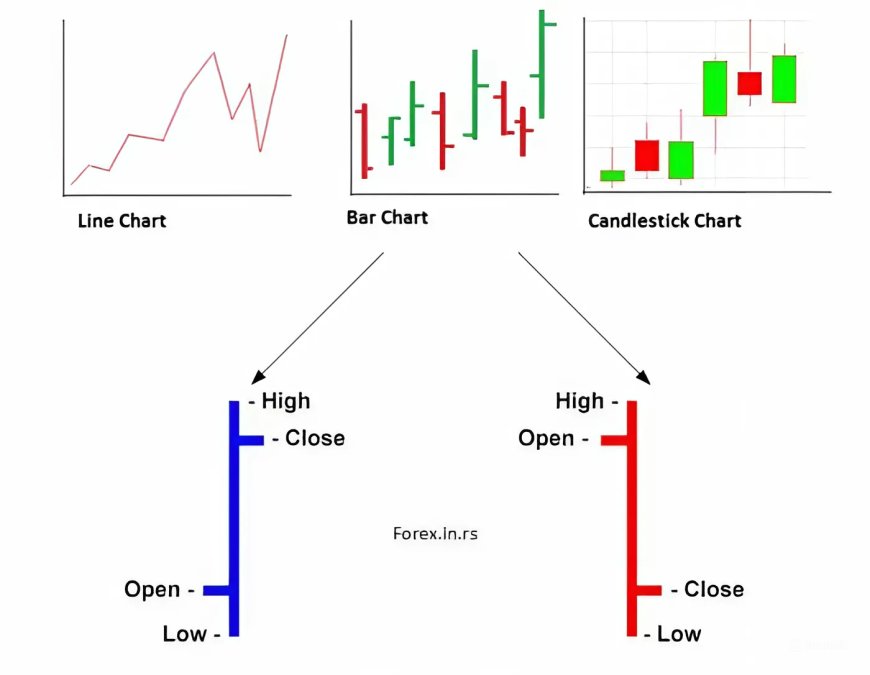
2. Bar Charts:
- More Information: Bar charts display four key pieces of information for each period:
- Open: The price at which the security started trading during that period.
- High: The highest price reached during the period.
- Low: The lowest price reached during the period.
- Close: The price at which the security ended trading during the period.
- Identifying Trading Ranges: The vertical bars in bar charts allow traders to easily visualize the trading range (the difference between the high and low) for each period. This information can be crucial for identifying potential support and resistance levels.
3. Candlestick Charts:
- Visual Appeal: Candlestick charts are known for their visually appealing and informative format. They resemble candles with a wider "body" and thin "wicks" (or shadows).
- Same Data, Different Presentation: Candlestick charts convey the same data as bar charts (open, high, low, close), but the unique visual representation makes them easier to interpret.
- Understanding Market Sentiment:
- Bullish Candles: A green or white body indicates that the closing price was higher than the opening price, suggesting buying pressure and a bullish sentiment.
- Bearish Candles: A red or black body indicates that the closing price was lower than the opening price, suggesting selling pressure and a bearish sentiment.
- Candlestick Patterns: Candlestick charts often form recognizable patterns (e.g., doji, hammer, engulfing patterns) that can signal potential trend reversals or continuations.
Choosing the Right Chart
The choice of chart type depends on the trader's preference and the specific analysis they are conducting. Line charts are excellent for quick trend identification, while bar charts and candlestick charts offer more detailed insights into price action and market sentiment. Many traders find candlestick charts to be the most visually intuitive and informative for technical analysis.
Key Technical Indicators for Indian Traders
Technical indicators are mathematical calculations based on a security's price and/or volume data. They help traders identify trends, potential reversals, and overbought or oversold conditions. Here are some of the most popular indicators used in the Indian market:
1. Moving Averages (MA):
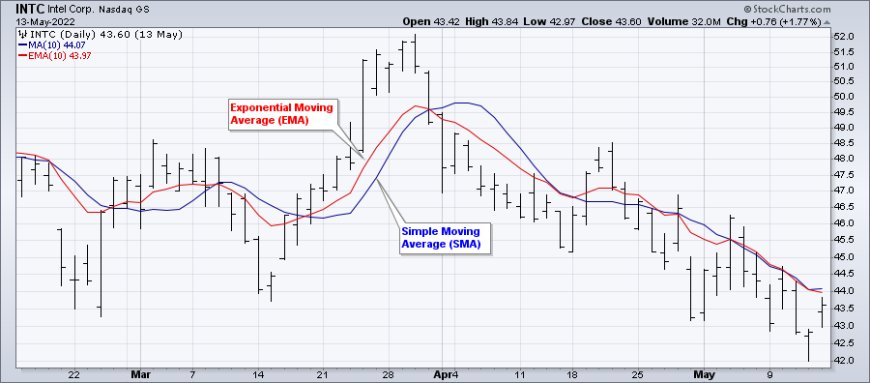
- Purpose: Moving averages smooth out price fluctuations, making it easier to identify the underlying trend.
- Types:
- Simple Moving Average (SMA): Calculates the average price over a specified period, giving equal weight to each data point.
- Exponential Moving Average (EMA): Gives more weight to recent price data, making it more responsive to current price changes.
- Common Uses:
- Identifying Trends: A rising MA suggests an uptrend, while a falling MA indicates a downtrend.
- Support and Resistance: MAs can act as dynamic support and resistance levels.
- Crossovers: Crossovers between different MAs can signal potential trend changes.
2. Relative Strength Index (RSI):
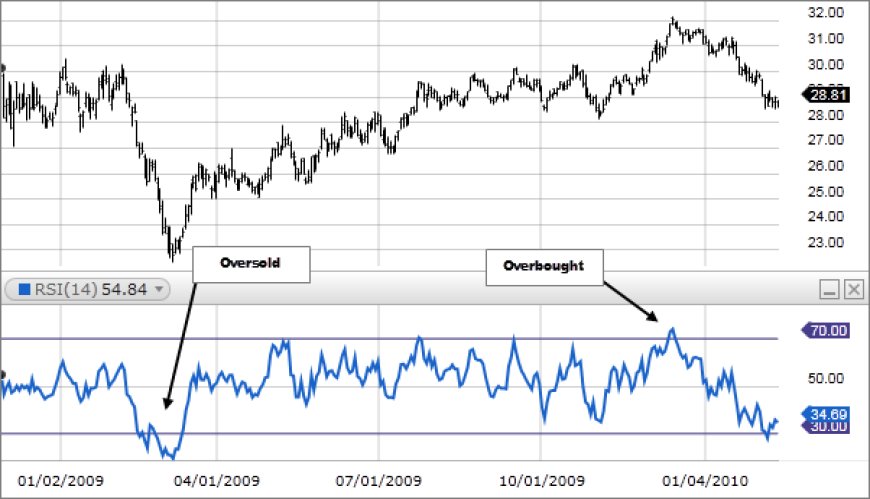
- Purpose: The RSI is a momentum oscillator that measures the magnitude of recent price changes to assess whether a security is overbought or oversold.
- Calculation: The RSI ranges from 0 to 100. Readings above 70 generally indicate overbought conditions, while readings below 30 suggest oversold conditions.
- Common Uses:
- Identifying Overbought/Oversold Conditions: The RSI can help traders spot potential reversals when a security is in extreme territory.
- Divergences: Divergences between price and the RSI can be early warning signs of trend changes.
3. Moving Average Convergence Divergence (MACD):
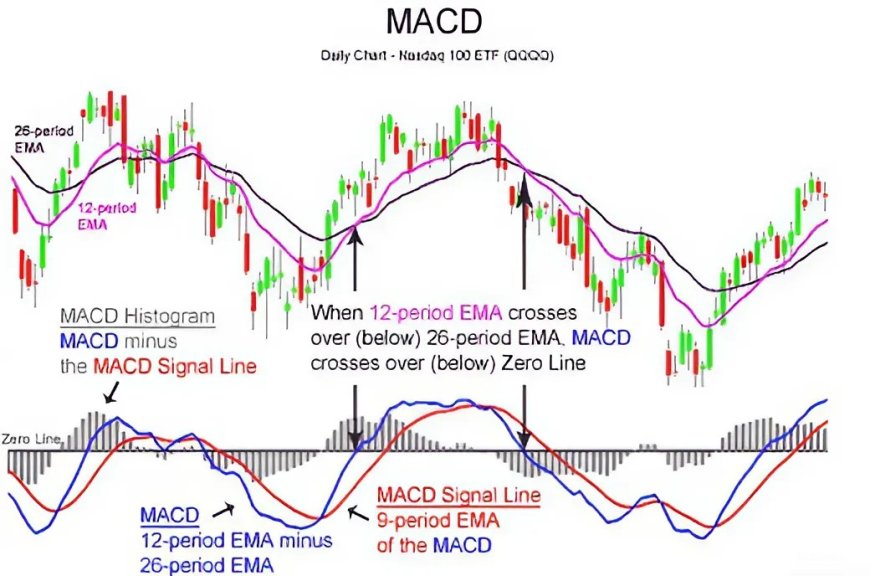
- Purpose: The MACD is a trend-following momentum indicator that shows the relationship between two exponential moving averages (EMAs).
- Components:
- MACD Line: The difference between the 12-day EMA and the 26-day EMA.
- Signal Line: A 9-day EMA of the MACD line.
- Histogram: The difference between the MACD line and the signal line.
- Common Uses:
- Trend Identification: The MACD line crossing above the signal line suggests a bullish trend, while a cross below indicates a bearish trend.
- Histogram: The histogram's direction and size can indicate the strength of the trend.
4. Bollinger Bands (BB):
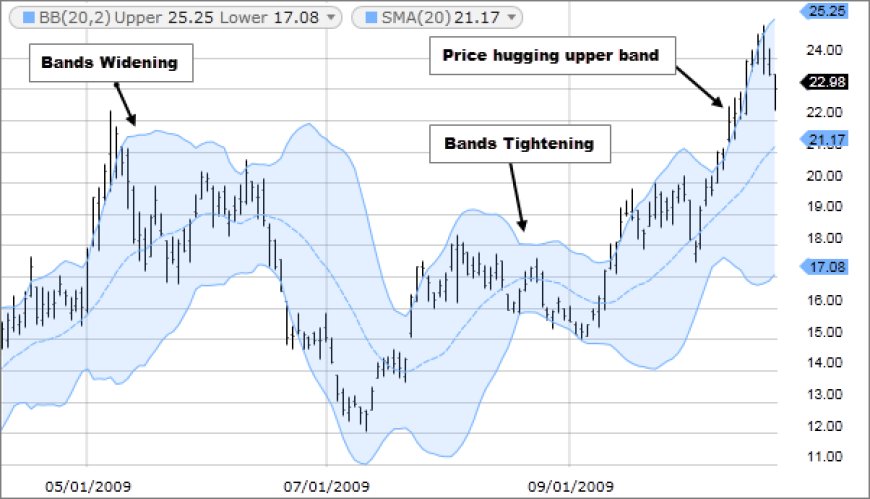
- Purpose: Bollinger Bands are volatility bands that measure how far a security's price has deviated from its average.
- Components:
- Middle Band: Usually a 20-day simple moving average (SMA).
- Upper Band: Two standard deviations above the middle band.
- Lower Band: Two standard deviations below the middle band.
- Common Uses:
- Volatility Assessment: The width of the bands indicates the level of volatility.
- Overbought/Oversold Conditions: Prices touching the upper band can suggest overbought conditions, while prices touching the lower band can indicate oversold conditions.
- Squeezes: A narrowing of the bands can signal a potential breakout in either direction.
Important Considerations:
- No Single Best Indicator: There is no single "best" technical indicator. Different indicators work better in different market conditions.
- Combining Indicators: Many traders use multiple indicators to confirm signals and increase the accuracy of their analysis.
- Backtesting: It's crucial to backtest your trading strategies using historical data to evaluate their effectiveness.
- Risk Management: Always use proper risk management techniques to protect your capital.
Chart Patterns: The Language of the Markets
Chart patterns are visual formations that appear on price charts. They are formed by the movements of a security's price over time. Technical analysts believe that these patterns can provide valuable insights into future price movements, acting as a language through which the market communicates its intentions.
1. Head and Shoulders (H&S):
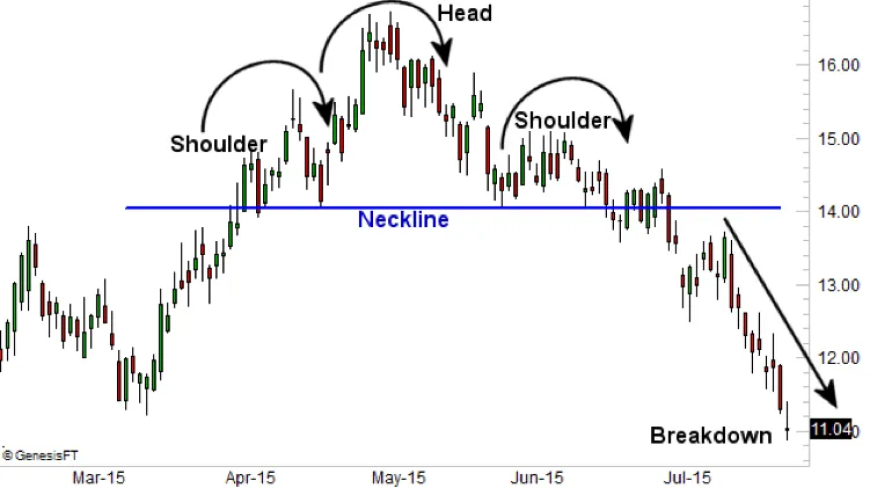
- Reversal Pattern: The H&S pattern is a bearish reversal pattern that typically forms after an uptrend.
- Formation: It consists of three peaks:
- The first and third peaks are lower (the shoulders).
- The middle peak is the highest (the head).
- Neckline: The pattern is confirmed when the price breaks below the neckline (a line drawn connecting the lows of the two shoulders).
- Target: The price target for the H&S pattern is often projected by measuring the distance from the head to the neckline and extending it downwards from the breakout point.
2. Double Top/Bottom:
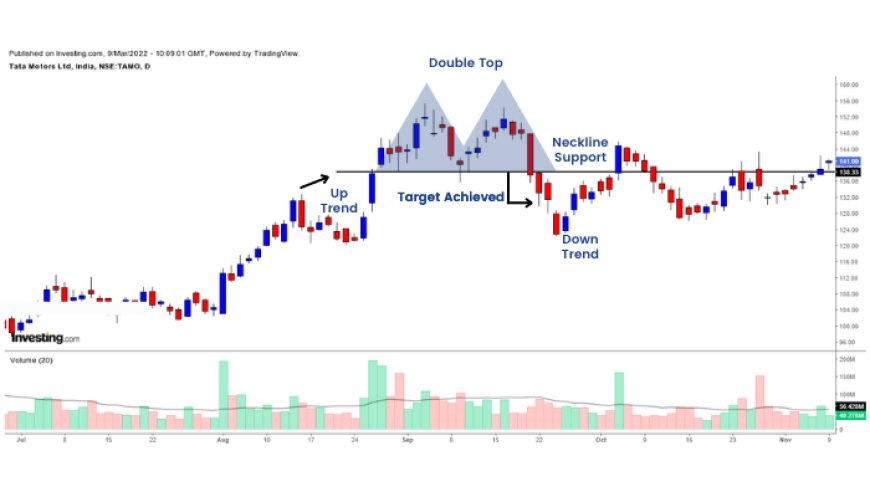
- Reversal Patterns: Double tops are bearish reversal patterns, while double bottoms are bullish reversal patterns.
- Formation:
- Double Top: Two peaks at roughly the same price level, with a trough in between.
- Double Bottom: Two troughs at roughly the same price level, with a peak in between.
- Confirmation: The patterns are confirmed when the price breaks below the neckline (for double tops) or above the neckline (for double bottoms).
- Target: The price target is often projected by measuring the distance from the peak (or trough) to the neckline and extending it in the direction of the breakout.
3. Triangles:
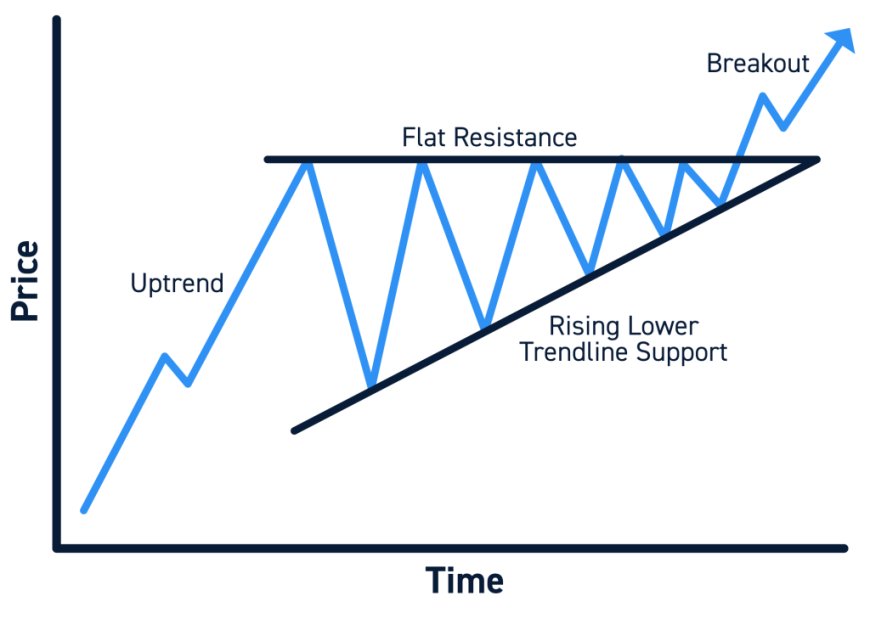
- Continuation or Reversal Patterns: Triangles can be either continuation or reversal patterns.
- Types:
- Ascending Triangle: A bullish pattern with a flat upper trendline and a rising lower trendline.
- Descending Triangle: A bearish pattern with a flat lower trendline and a falling upper trendline.
- Symmetrical Triangle: A neutral pattern with converging upper and lower trendlines.
- Breakout: The price usually breaks out of the triangle before it reaches its apex. The direction of the breakout often determines the direction of the subsequent price move.
4. Flags and Pennants:

- Continuation Patterns: Flags and pennants are short-term continuation patterns that typically occur during a strong trend.
- Formation:
- Flag: A brief consolidation period with parallel upper and lower trendlines.
- Pennant: A brief consolidation period with converging upper and lower trendlines.
- Pole: The flag or pennant is preceded by a sharp price move (the pole).
- Breakout: The pattern is confirmed when the price breaks out in the direction of the original trend.

Using Chart Patterns Effectively
- Confirmation: Always wait for confirmation before acting on a pattern. A breakout or breakdown should be confirmed by other technical indicators or price action.
- False Signals: Be aware that chart patterns can sometimes produce false signals. It's important to use them in conjunction with other analysis tools and risk management strategies.
- Multiple Time Frames: Analyze patterns on multiple time frames to get a more comprehensive view of the market.
Putting It All Together: A Sample Technical Analysis of Reliance Industries (RELIANCE)
Let's imagine you're analyzing the chart of Reliance Industries (RELIANCE), a prominent conglomerate listed on the National Stock Exchange (NSE) of India. You've been observing its price movements for a few weeks and have gathered the following information:
-
Long-Term Trend: The RELIANCE stock price has been steadily climbing over the past few months, consistently trading above its 200-day simple moving average (SMA). This suggests a well-established uptrend.
-
Short-Term Momentum: You decide to zoom in on the daily chart to assess short-term momentum. You notice that the Relative Strength Index (RSI) has been hovering above 70 for several days. This indicates that the stock might be overbought in the short term, meaning its price may have risen too quickly and could be due for a pullback.
-
Candlestick Pattern: On the most recent trading day, a bearish engulfing candlestick pattern has formed. This pattern occurs when a large red (or black) candlestick completely engulfs the previous green (or white) candlestick. It's often interpreted as a bearish signal, suggesting a potential reversal of the current uptrend.
Interpretation and Decision:
Taking all three pieces of information together, you arrive at the following interpretation:
- The Uptrend: While the long-term trend remains bullish, the overbought RSI and the bearish engulfing pattern suggest a potential short-term reversal or correction.
- The Risk: The risk here is that if you continue to hold your long position, the price of RELIANCE could drop, leading to a loss.
- The Opportunity: Alternatively, this could be an opportunity to take profits on your existing long position or even initiate a short position (if you're comfortable with short-selling) to potentially profit from the anticipated downward move.
Action Plan:
Based on this analysis, you might decide to take one or more of the following actions:
-
Sell Existing Position: If you currently hold shares of RELIANCE, you could sell some or all of your position to lock in profits and protect yourself from a potential downside move.
-
Hold and Monitor: You could choose to hold onto your shares and closely monitor the price action. If the price continues to decline and breaks below key support levels, you might consider selling at that point.
-
Initiate a Short Position: If you're experienced with short-selling, you could potentially initiate a short position to profit from a potential decline in the stock price. However, short-selling carries higher risks and should only be undertaken by experienced traders.
Important Note:
This is a simplified example. In reality, technical analysis involves a more in-depth examination of various indicators and patterns across different time frames. It's also essential to consider fundamental factors and overall market conditions before making any trading decisions.
Caveats and Considerations for Indian Investors
Technical analysis is a powerful tool in the hands of a skilled trader, but it's essential to approach it with a realistic perspective and understand its limitations.
1. Not a Crystal Ball:
- Probability, Not Certainty: Technical analysis provides insights into potential future price movements based on historical patterns. However, it does not guarantee those movements. Markets are complex and influenced by numerous factors, including economic events, geopolitical developments, and unforeseen events.
- False Signals: Technical indicators and patterns can sometimes generate false signals, leading to incorrect predictions. It's crucial to confirm signals with other forms of analysis and always be prepared for unexpected outcomes.
2. Subjectivity:
- Interpretation: While technical analysis relies on objective data, the interpretation of chart patterns and indicators can be subjective. Different analysts might see different things in the same chart, leading to varying conclusions.
- Bias: Traders might be influenced by their own biases and emotions, which can cloud their judgment and lead to irrational decisions.
3. Not a Standalone Strategy:
- Complementary Tool: Technical analysis is most effective when used in conjunction with other research methods, such as fundamental analysis. Fundamental analysis assesses a company's financial health and growth prospects, providing a more comprehensive view of its value.
- Risk Management: Technical analysis should always be coupled with sound risk management strategies. Traders should set stop-loss orders to limit potential losses and never risk more than they can afford to lose.
4. Market Manipulation:
- Large Players: In some cases, large institutional investors or market makers can deliberately manipulate prices to create false signals or trigger stop-loss orders. While rare, this is a potential risk that traders need to be aware of.
5. Over-Optimization:
- Backtesting Bias: It's possible to over-optimize trading strategies during backtesting, leading to unrealistic expectations of future performance. It's essential to test strategies on out-of-sample data and be mindful of potential biases.
By understanding the limitations and potential pitfalls of technical analysis, Indian investors can use it more effectively to enhance their trading strategies and make informed decisions. Remember, technical analysis is a tool to aid decision-making, not a magic formula for guaranteed success.
Essential Tips for Indian Traders and Investors Utilizing Technical Analysis
The Indian stock market offers a wealth of opportunities, but navigating its complexities requires knowledge, skill, and discipline. Here are some practical tips to help you leverage technical analysis effectively:
1. Lay a Strong Foundation:
- Learn the Basics: Start by thoroughly understanding different chart types (line, bar, candlestick), key technical indicators (moving averages, RSI, MACD, Bollinger Bands), and common chart patterns (head and shoulders, double tops/bottoms, triangles, flags).
- Utilize Resources: Take advantage of free online courses, tutorials, and books on technical analysis. The National Stock Exchange (NSE) of India offers educational resources, as do many brokerage firms.
- Join Communities: Engage with online forums and communities where you can interact with other Indian traders and learn from their experiences.
2. Practice with Paper Trading:
- Virtual Trading: Most online brokers offer virtual trading platforms or paper trading accounts. Use these to test your technical analysis skills and strategies without risking real capital.
- Experiment: Experiment with different indicators, chart patterns, and time frames to find what works best for you.
- Track Your Results: Keep a detailed log of your paper trades, including your analysis, entry and exit points, and profits or losses. This will help you identify areas for improvement.
3. Focus on a Few Key Indicators:
- Avoid Information Overload: It's easy to get overwhelmed by the sheer number of available technical indicators. Start with a few core indicators that align with your trading style and risk tolerance.
- Master Their Use: Focus on understanding how these indicators work, their strengths and weaknesses, and how to interpret their signals in different market contexts.
- Customize: As you gain experience, you can gradually add or refine indicators to tailor your analysis to specific securities or market conditions.
4. Maintain Discipline:
- Trading Plan: Develop a well-defined trading plan that outlines your entry and exit criteria, risk management rules, and overall trading strategy. Stick to your plan even when emotions run high.
- Emotional Control: Fear and greed are common emotions that can lead to impulsive decisions and losses. Practice mindfulness and stress-management techniques to maintain emotional control.
- Journaling: Keep a trading journal to track your emotions, decisions, and outcomes. This will help you identify patterns in your behavior and improve your decision-making over time.
5. Embrace Patience:
- Learning Curve: Technical analysis takes time and practice to master. Don't expect overnight success.
- Market Cycles: Understand that markets go through cycles of ups and downs. Be patient during periods of consolidation or drawdown, and focus on the long-term.
- Continuous Learning: The financial markets are constantly evolving. Stay updated with new techniques, tools, and market trends to remain competitive.
Additional Tips for Indian Traders:
- Consider Local Market Conditions: The Indian market has its own unique characteristics and nuances. Pay attention to local news, economic data, and regulatory changes that could impact your analysis.
- Focus on Liquidity: Prioritize liquid stocks to ensure you can easily enter and exit positions.
- Consult with Professionals: If you're new to technical analysis or unsure about your strategies, consider seeking guidance from experienced traders or financial advisors.
By adhering to these tips and consistently applying the principles of technical analysis, Indian traders and investors can equip themselves with the knowledge and skills needed to navigate the dynamic Indian stock market and achieve their financial goals. Remember, technical analysis is a journey, not a destination. Embrace the learning process, stay disciplined, and adapt to changing market conditions to unlock the potential of this powerful tool.
Conclusion: Mastering Technical Analysis for Success in the Indian Market
As we've explored in this comprehensive guide, technical analysis is a versatile and powerful tool that can significantly enhance your trading and investment decisions in the vibrant Indian market. By delving into the intricacies of charts, indicators, and patterns, you can decipher the market's language and anticipate potential price movements. However, remember that technical analysis is not a magic formula for instant riches. It's a skill that requires continuous learning, practice, and discipline.
Embrace the following key takeaways to maximize your success with technical analysis:
- Holistic Approach: Integrate technical analysis with fundamental analysis and sound risk management strategies to gain a well-rounded perspective of the market.
- Adaptability: Markets are dynamic and ever-changing. Be prepared to adjust your strategies as conditions evolve.
- Humility and Discipline: Accept that losses are a part of trading, learn from your mistakes, and never deviate from your well-defined trading plan.
- Indian Market Context: Tailor your technical analysis to the unique characteristics of the Indian market, considering local news, economic data, and regulatory changes.
- Lifelong Learning: The world of finance is constantly evolving. Stay updated with the latest techniques, tools, and trends in technical analysis to stay ahead of the curve.
By consistently applying these principles and diligently honing your skills, you can unlock the true potential of technical analysis. It can empower you to make informed decisions, manage risks effectively, and ultimately achieve your financial goals in the dynamic and exciting Indian market.
Remember, technical analysis is not just about predicting price movements – it's about understanding market psychology, identifying opportunities, and mitigating risks. With dedication and perseverance, you can transform technical analysis from a mere tool into a powerful ally in your journey towards financial success.
Additional Resources:
To further your understanding of technical analysis, consider exploring the following resources:
- NSE India: The National Stock Exchange of India offers educational resources on technical analysis, including courses, webinars, and publications.
- Online Brokers: Many online brokers in India provide educational materials and tools for technical analysis.
- Books and Blogs: There are numerous books and blogs dedicated to technical analysis, catering to both beginners and experienced traders.
The Indian market is brimming with possibilities. With the knowledge and skills you've gained from this guide, you're well-equipped to navigate its complexities and achieve your investment goals. Embrace the power of technical analysis and embark on a rewarding journey in the world of Indian finance.
Disclaimer:
The information provided in this article about technical analysis is for educational purposes only and should not be considered financial advice. Investing in the stock market involves substantial risk, and past performance is not indicative of future results.
Technical analysis is just one tool among many that can be used to evaluate investment opportunities. It's important to conduct thorough research, consider your individual financial situation and risk tolerance, and consult with a qualified financial advisor before making any investment decisions.
The author and publisher of this article are not responsible for any losses or damages incurred as a result of using the information presented herein.
What's Your Reaction?