Mastering the Art of Candlestick Patterns: A Comprehensive Guide for Indian Investors
Master the art of candlestick patterns with this comprehensive guide for Indian investors. Learn to identify bullish and bearish reversal patterns like the hammer, hanging man, engulfing patterns, morning star, evening star, and more. Enhance your technical analysis skills and make informed trading decisions in the Indian stock market.

In the dynamic world of the Indian stock market, where fortunes are made and lost with the blink of an eye, having a keen understanding of technical analysis is paramount. Among the many tools available to traders and investors, candlestick patterns stand out as a timeless and visually intuitive method for deciphering market sentiment and predicting potential price movements.
Rooted in centuries of Japanese rice trading tradition, candlestick patterns have transcended cultural boundaries to become a cornerstone of technical analysis globally. They provide invaluable insights into the psychology of market participants, revealing the underlying forces of supply and demand that drive price action.
In this comprehensive guide, we'll delve into the fascinating world of candlestick patterns, exploring their origins, significance, and practical applications in the Indian stock market. Whether you're a seasoned investor or a novice trader, mastering the art of candlestick patterns can empower you to make more informed and profitable investment decisions.
The Language of Candlesticks: Decoding Market Sentiment
Candlesticks are more than just graphical representations of price; they are visual narratives that tell the story of market sentiment. Each element of a candlestick—the real body, the upper shadow, and the lower shadow—conveys valuable information about the interplay between buyers and sellers during a specific trading period.
Real Body: The Battleground of Bulls and Bears
The real body is the heart of the candlestick, depicting the range between the opening and closing prices. It serves as a visual representation of the battle between bulls and bears:
- Green (or White) Real Body: A green real body signifies a bullish session. The bulls have won the battle, pushing the closing price higher than the opening price. This indicates buying pressure and optimism in the market.
- Red (or Black) Real Body: A red real body represents a bearish session. The bears have gained the upper hand, driving the closing price lower than the opening price. This signals selling pressure and pessimism in the market.
The length of the real body also reveals the intensity of the battle. A long real body indicates a decisive victory for either the bulls or bears, while a short real body suggests a more balanced struggle.
Shadows: Whispers of Volatility and Uncertainty
The shadows, also known as wicks, extend from the top and bottom of the real body, depicting the highest and lowest prices reached during the trading session. They offer insights into the volatility and uncertainty within the market:
- Upper Shadow: The upper shadow reveals the highest price achieved during the session. A long upper shadow indicates that buyers initially pushed prices higher but were met with selling pressure, causing prices to retreat.
- Lower Shadow: The lower shadow shows the lowest price reached during the session. A long lower shadow suggests that sellers initially drove prices lower but were met with buying pressure, leading to a price rebound.
The length and position of the shadows provide valuable clues about market sentiment. For instance, a long upper shadow and a short lower shadow may suggest that buyers are losing momentum, while a long lower shadow and a short upper shadow may indicate that sellers are losing their grip.
Putting It All Together
By analyzing the real body and shadows together, traders can gain a deeper understanding of market dynamics. For example:
- Long green real body with short shadows: This indicates strong bullish momentum with minimal price rejection.
- Long red real body with short shadows: This suggests strong bearish momentum with minimal price rejection.
- Small real body with long upper and lower shadows: This signifies indecision and volatility in the market.
The length and positioning of the real body and shadows provide crucial clues about the battle between buyers (bulls) and sellers (bears) during a particular timeframe.
Single Candlestick Patterns
1. Doji: The Enigma of Indecision
In the realm of candlestick analysis, the Doji stands out as a unique and intriguing pattern. It signifies a state of equilibrium, a stalemate between buyers and sellers, where neither side manages to gain a decisive advantage. This indecision is reflected in the near-identical opening and closing prices, resulting in a real body that is either very small or completely absent.
Dojis are often viewed as a neutral pattern, but their interpretation depends on the context and the accompanying price action. They can signal a continuation of the existing trend, a potential reversal, or simply a pause before the market decides on its next direction.
Variations of the Doji: Unraveling the Nuances
The Doji family encompasses several variations, each with its own subtle nuances and implications:

a) Standard Doji: A Glimpse into Market Equilibrium
The Standard Doji is the most basic and common type of Doji pattern. It's characterized by a very small or nonexistent real body, indicating that the opening and closing prices are almost identical. This signifies a state of indecision in the market, where neither buyers (bulls) nor sellers (bears) have been able to gain a clear advantage.
Key Characteristics
- Small or Nonexistent Real Body: The defining feature of a Standard Doji is its tiny real body, which can be either white (or green), black (or red), or even just a horizontal line. The smaller the real body, the greater the indecision in the market.
- Varying Shadow Lengths: The shadows of a Standard Doji can vary in length. They may be short, long, or somewhere in between. The length of the shadows indicates the price range during the trading period. Long shadows suggest a high degree of volatility, while short shadows indicate a more subdued price action.
Interpretation
A Standard Doji is primarily a neutral pattern. It doesn't necessarily predict a trend reversal or continuation. However, it does provide valuable insights into market sentiment and can be interpreted in different ways depending on the context:
- Continuation Pattern: In a trending market, a Standard Doji may signal a temporary pause or consolidation before the trend resumes. It suggests that the current trend is losing momentum but hasn't reversed yet.
- Reversal Pattern: If a Standard Doji appears near a key support or resistance level, it could be a warning sign of a potential trend reversal. This is especially true if the Doji is accompanied by other reversal signals, such as a change in volume or momentum.
- Indecision and Uncertainty: In a ranging or choppy market, a Standard Doji simply reflects the ongoing indecision and lack of direction. Traders should exercise caution and wait for a clearer signal before making a decision.
b) Long-Legged Doji: A Tug-of-War Between Bulls and Bears
The Long-Legged Doji stands as a testament to the intense battles that often unfold in financial markets. This dramatic candlestick pattern is characterized by a small real body, or even no real body at all, accompanied by exceptionally long upper and lower shadows. This visual representation depicts a trading session marked by extreme price volatility and a tug-of-war between buyers (bulls) and sellers (bears).
Unveiling the Inner Workings
- Opening Price: The session begins with an opening price, and initially, either the bulls or the bears gain momentum, driving the price in their desired direction.
- Price Fluctuation: As the trading session progresses, the opposing force gains strength, pushing the price back towards the opening level. This back-and-forth struggle creates the long shadows that extend from the real body.
- Closing Price: By the end of the session, the opposing forces essentially cancel each other out, resulting in a closing price that is very close to the opening price.
Interpreting the Long-Legged Doji
The Long-Legged Doji primarily signifies indecision and heightened uncertainty in the market. The long shadows indicate a wide range of price fluctuations, revealing that both buyers and sellers were active but ultimately failed to establish dominance.
Here's how you can interpret a Long-Legged Doji in different contexts:
- Trend Reversal: In a trending market, the Long-Legged Doji can act as a warning sign of a potential trend reversal. It suggests that the current trend is losing momentum and that the opposing force is gaining strength.
- Market Bottom/Top: When a Long-Legged Doji appears near a potential market bottom or top, it can signal a turning point in the price action. However, it's crucial to confirm this with other technical indicators or price patterns before making a trading decision.
- Consolidation: In a sideways or choppy market, the Long-Legged Doji indicates continued indecision and uncertainty. Traders should remain cautious and wait for a clearer signal before entering a position.
c) Dragonfly Doji: A Glimmer of Hope Amidst the Downtrend
The Dragonfly Doji, with its distinctive "T" shape, emerges as a beacon of hope in the midst of a bearish downtrend. This unique candlestick pattern features a long lower shadow, a small or nonexistent real body, and little to no upper shadow. It signals a significant shift in market sentiment, indicating that despite an initial push by sellers, buyers were able to regain control and drive prices back up.
Anatomy of the Dragonfly Doji
- Opening Price: The trading session commences with an opening price, and sellers quickly take charge, pushing prices lower.
- Price Plunge: The selling pressure intensifies, leading to a sharp decline in prices, represented by the long lower shadow.
- Buyer Intervention: As prices reach a certain low point, buyers step in and start accumulating the asset.
- Price Recovery: The buying pressure gradually builds up, causing prices to rebound and recover most of the losses.
- Closing Price: The session closes near the opening price, resulting in a small or nonexistent real body.
Interpreting the Dragonfly Doji
The Dragonfly Doji is predominantly a bullish reversal pattern. Its appearance in a downtrend suggests that the selling pressure is weakening, and buyers are starting to take control. The long lower shadow indicates that sellers were unable to sustain the downward momentum, and the price recovery reflects the strength of the buying pressure.
Here's how you can interpret a Dragonfly Doji in different scenarios:
- Bottom Reversal: When a Dragonfly Doji forms near a support level or after a prolonged downtrend, it's a strong indication of a potential reversal to the upside.
- Continuation Pattern: In rare cases, a Dragonfly Doji can appear within an uptrend as a continuation pattern. However, it's less reliable in this context.
- False Signal: While the Dragonfly Doji is generally a bullish signal, it's not always accurate. It's essential to look for confirmation from other technical indicators or price patterns before making a trading decision.
d) Gravestone Doji: A Warning Sign from the Market
The Gravestone Doji, with its ominous name and appearance, is a candlestick pattern that sends shivers down the spines of bullish traders. Resembling an upside-down "T" or a tombstone, this pattern typically emerges at the peak of an uptrend, signaling a potential reversal to the downside.
Anatomy of the Gravestone Doji
- Opening Price: The trading session begins with an opening price, and optimistic buyers quickly push prices higher, fueled by enthusiasm and momentum.
- Price Surge: The buying pressure intensifies, propelling prices to a new high for the session. This surge is represented by the long upper shadow of the Gravestone Doji.
- Seller Dominance: However, the bullish momentum is short-lived. Sellers enter the market with force, overwhelming the buyers and pushing prices back down.
- Closing Price: The session closes near the opening price, forming a small or nonexistent real body. The failure of buyers to maintain the upward momentum and the strong selling pressure are reflected in this pattern.
Interpreting the Gravestone Doji
The Gravestone Doji is primarily a bearish reversal pattern. It signals that the bullish trend is losing steam, and sellers are gaining control. The long upper shadow indicates that buyers were unable to sustain the upward momentum, and the price rejection from the highs suggests a shift in market sentiment.
Here's how you can interpret a Gravestone Doji in different scenarios:
- Top Reversal: When a Gravestone Doji appears near a resistance level or after a prolonged uptrend, it's a strong indication of a potential reversal to the downside.
- Continuation Pattern (Rare): In rare cases, a Gravestone Doji can appear within a downtrend as a continuation pattern. However, it's less reliable in this context.
- False Signal: While the Gravestone Doji is generally a bearish signal, it's not always accurate. It's essential to look for confirmation from other technical indicators or price patterns before making a trading decision.
e) Four Price Doji: The Pinnacle of Indecision
While all Doji patterns signal indecision, the Four Price Doji takes it to the absolute extreme. It occurs when the opening, closing, high, and low prices are all identical, or nearly so. This results in a single horizontal line on a candlestick chart, as there's no price movement within the trading period.
Significance and Interpretation
- Extreme Indecision: The Four Price Doji represents the highest level of market indecision possible. Neither buyers nor sellers were able to move the price, creating a perfect stalemate.
- Rare Occurrence: This pattern is relatively rare, especially on higher timeframes like daily or weekly charts. Its appearance often indicates very low trading volume or illiquid markets.
- Limited Predictive Power: Due to its rarity and the context in which it appears (often in low-volume or illiquid markets), the Four Price Doji doesn't have strong predictive power on its own. It doesn't necessarily indicate a trend reversal or continuation.
- Context Matters: The significance of a Four Price Doji is heavily dependent on the surrounding market context. It's crucial to consider the prevailing trend, support and resistance levels, and other technical indicators to gain a better understanding of its potential implications.
Spotting a Four Price Doji
To identify a Four Price Doji, look for the following characteristics:
- Horizontal Line: The candlestick should appear as a single horizontal line, indicating no price movement within the trading period.
- Low Volume: The trading volume associated with the Four Price Doji is typically very low, reflecting the lack of market activity.
- Market Conditions: Consider the overall market conditions. A Four Price Doji in a trending market may have different implications than one in a ranging market.
Interpreting Doji Patterns in the Indian Stock Market
While Doji patterns can occur in any market, their interpretation in the Indian stock market requires careful consideration of the broader context. Here are some key factors to consider:
- Prior Trend: A Doji in an uptrend may signal a potential weakening of the uptrend, while a Doji in a downtrend may suggest a potential slowing down of the downtrend.
- Support and Resistance Levels: The location of a Doji relative to key support and resistance levels can provide valuable clues about its significance. A Doji near a support level may suggest a potential bounce, while a Doji near a resistance level may indicate a potential reversal.
- Volume: The volume accompanying a Doji can offer insights into the strength of the pattern. A Doji with high volume may be more significant than a Doji with low volume.
- Additional Confirmation: Look for confirmation from other technical indicators, such as moving averages or oscillators, before making a trading decision based on a Doji pattern.
Doji patterns are versatile tools that can provide valuable insights into market sentiment. By understanding their nuances and interpreting them within the broader context, Indian investors can leverage Doji patterns to make more informed and profitable trading decisions.
2. Hammer and Hanging Man: Signals of Potential Trend Reversals
These two candlestick patterns share a similar appearance but convey opposite messages about market sentiment. Both patterns feature a small real body located at the top (Hammer) or bottom (Hanging Man) of a long lower shadow. The small real body indicates a period of indecision, while the long lower shadow reveals a significant price drop followed by a subsequent recovery.
The Hammer: A Beacon of Hope in a Downtrend

The Hammer is a captivating candlestick pattern that often emerges like a beacon of hope in the midst of a bearish downtrend. Its appearance can signify a potential turning point, where the tide of selling pressure subsides and buying interest starts to gain momentum.
Unveiling the Hammer's Anatomy
- Opening Price: The trading session commences with an opening price, and initially, the bears dominate, pushing prices lower.
- Price Plunge: The selling pressure intensifies, leading to a sharp decline in prices, as reflected in the long lower shadow of the Hammer.
- Buyer Intervention: As prices reach a certain low point, buyers sense a potential bargain and start accumulating the asset.
- Price Recovery: The buying pressure gradually builds up, causing prices to rebound from the lows and recover a significant portion of the losses.
- Closing Price: The session closes near the opening price, resulting in a small real body. The small real body indicates a period of indecision as the market assesses the shift in sentiment.
Interpreting the Hammer's Message
The Hammer is primarily a bullish reversal pattern. Its appearance in a downtrend signals a potential shift in power from sellers to buyers. The long lower shadow signifies that sellers were unable to maintain control at lower prices, and the subsequent price recovery indicates a resurgence of buying interest.
Here's what the Hammer can tell us about market sentiment:
- Buyer Confidence: The Hammer demonstrates that buyers are confident enough to step in at lower prices and drive prices back up.
- Seller Exhaustion: The long lower shadow suggests that sellers may be becoming exhausted, and their downward pressure is weakening.
- Potential Reversal: The Hammer can be a precursor to a trend reversal, especially if it occurs near a support level or after a prolonged downtrend.
The Hanging Man: A Warning Sign in the Uptrend

The Hanging Man, a bearish candlestick pattern, casts a shadow of doubt on the continuation of an uptrend. It's essentially a mirror image of the Hammer, but its appearance in an uptrend carries a very different message. While the Hammer signifies potential bullish reversal, the Hanging Man warns of a potential bearish reversal, indicating that the bulls may be losing their grip on the market.
Anatomy of the Hanging Man
- Opening Price: The trading session begins with an opening price, and initially, the bulls dominate, driving prices higher, fueled by optimism and confidence.
- Price Surge: The buying pressure intensifies, propelling prices to a new high for the session. This surge is represented by the initial upward movement.
- Seller Intervention: However, as the session progresses, sellers enter the market with force, pushing prices back down. This downward pressure creates the long lower shadow, revealing that sellers were able to temporarily take control.
- Price Recovery: Towards the end of the session, buyers manage to stage a partial recovery, but not enough to erase the earlier losses.
- Closing Price: The session closes near the opening price, resulting in a small real body. The small real body indicates a period of indecision as the market assesses the shift in sentiment.
Interpreting the Hanging Man
The Hanging Man is a red flag for bullish traders, suggesting that the upward momentum may be waning. The long lower shadow indicates that sellers were able to exert significant pressure during the session, and the failure of buyers to hold onto the gains raises concerns about the sustainability of the uptrend.
Here's what the Hanging Man can tell us about market sentiment:
- Buyer Exhaustion: The long lower shadow suggests that buyers are losing steam and struggling to maintain control.
- Seller Emergence: The presence of sellers pushing prices down indicates a potential shift in power.
- Possible Reversal: The Hanging Man can be a precursor to a trend reversal, especially if it occurs near a resistance level or after a prolonged uptrend.
3. Marubozu: A Statement of Market Dominance

The Marubozu is a bold and decisive candlestick pattern that leaves little room for ambiguity. It's characterized by a long real body with virtually no shadows (or very short shadows), conveying a clear message of strong buying or selling pressure.
Anatomy of the Marubozu
- Opening Price: The trading session begins with an opening price, and either the buyers (bulls) or sellers (bears) immediately seize control.
- Price Movement: The dominant force relentlessly pushes prices in their desired direction throughout the trading session.
- Closing Price: The session closes near the high (for a bullish Marubozu) or low (for a bearish Marubozu) of the day, leaving little room for any price retracement.
Interpreting the Marubozu
The interpretation of a Marubozu depends on its color:
-
Bullish Marubozu (White or Green): This pattern signifies strong buying pressure. Buyers controlled the market from the opening bell to the closing bell, pushing prices higher with conviction. It suggests a strong continuation of an uptrend or a potential reversal from a downtrend.
-
Bearish Marubozu (Black or Red): This pattern signals strong selling pressure. Sellers dominated the market throughout the session, driving prices lower with force. It indicates a strong continuation of a downtrend or a potential reversal from an uptrend.
In both cases, the absence of shadows reinforces the message of market dominance. It suggests that the opposing force was virtually absent or unable to mount any significant resistance.
4. Spinning Top: A Market in Flux
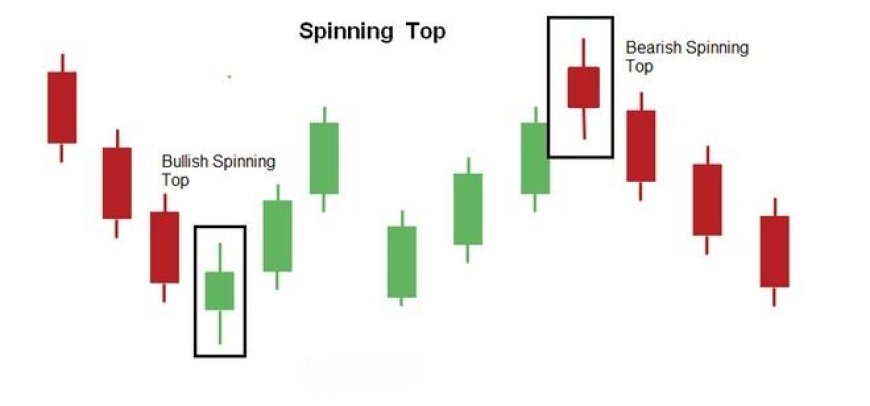
The Spinning Top, a seemingly unassuming candlestick pattern, offers a glimpse into a market teetering on the edge of indecision. With its small real body dwarfed by long upper and lower shadows, it paints a picture of a trading session where neither bulls nor bears could gain a significant advantage.
Anatomy of the Spinning Top
- Opening Price: The session begins with an opening price, and initially, either the bulls or the bears attempt to establish control, pushing prices in their desired direction.
- Price Volatility: However, the opposing force quickly enters the fray, causing prices to fluctuate within a wide range. This back-and-forth struggle creates the long upper and lower shadows that extend from the small real body.
- Closing Price: By the end of the session, the opposing forces essentially neutralize each other, resulting in a closing price that is close to the opening price.
Interpreting the Spinning Top
The Spinning Top is primarily a neutral pattern, signifying a state of equilibrium in the market. The small real body indicates that neither buyers nor sellers were able to gain a decisive victory, while the long shadows reveal a high degree of volatility and uncertainty.
Here's what the Spinning Top can tell us about market sentiment:
- Indecision and Uncertainty: The Spinning Top represents a market that is unsure of its next move. Buyers and sellers are evenly matched, and the price is fluctuating within a wide range.
- Potential Reversal or Continuation: The Spinning Top can be a precursor to either a trend reversal or a continuation of the existing trend. The subsequent price action will determine the actual outcome.
- Consolidation: In a sideways or choppy market, the Spinning Top indicates a continuation of the consolidation phase. Traders should exercise caution and wait for a clearer signal before entering a position.
5. Shooting Star: A Warning Flare in the Uptrend
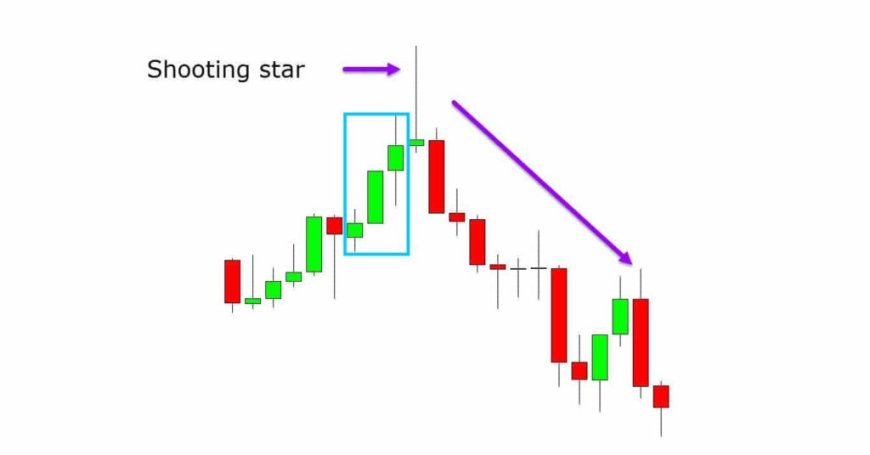
The Shooting Star, a single candlestick pattern, is like a warning flare launched in the night sky, signaling a potential shift from an uptrend to a downtrend. It shares a resemblance with the Inverted Hammer but carries a different message due to its placement within an existing uptrend.
Anatomy of the Shooting Star
- Opening Price: The trading session begins with an opening price, and initially, the bulls maintain control, pushing prices higher.
- Price Surge: Optimism fuels a strong upward momentum, propelling prices to a new high for the session. This surge is represented by the long upper shadow of the Shooting Star.
- Seller Intervention: However, as the session progresses, sellers enter the market with force, pushing prices back down. This downward pressure is significant, as reflected in the long upper shadow.
- Closing Price: The session closes near the opening price, forming a small real body. The small real body indicates indecision, as the bulls and bears battle for control.
Interpreting the Shooting Star
The Shooting Star is primarily a bearish reversal pattern. It signals a potential shift in sentiment from bullish to bearish, suggesting that the uptrend may be losing steam.
Key Characteristics of a Shooting Star:
- Uptrend: The pattern forms within an uptrend.
- Small Real Body: The real body is small and can be either bullish or bearish.
- Long Upper Shadow: The upper shadow is at least twice the length of the real body, indicating a significant price rejection from the highs.
- Little or No Lower Shadow: The lower shadow is very small or nonexistent, suggesting that the price did not fall much below the opening price.
Trading Implications in the Indian Market
When encountering a Shooting Star pattern in the Indian stock market, traders should exercise caution and consider the following:
- Confirmation: Look for a subsequent bearish candlestick, such as a long red candle or a gap down, to confirm the reversal signal.
- Volume: A Shooting Star with high volume on the upper shadow indicates stronger selling pressure and increases the likelihood of a reversal.
- Resistance Levels: A Shooting Star near a resistance level strengthens the bearish signal, as it indicates that the buyers are struggling to break through the resistance.
6. Inverted Hammer: A Hammer of Hope in Disguise

The Inverted Hammer, a single candlestick pattern, resembles a hammer flipped upside down. It's characterized by a small real body at the bottom of the candlestick, a long upper shadow, and little to no lower shadow. This pattern typically appears during a downtrend and can signal a potential bullish reversal.
Anatomy of the Inverted Hammer
- Opening Price: The trading session starts with an opening price, and initially, sellers drive prices lower.
- Price Plunge: The selling pressure intensifies, leading to a sharp decline in prices, as reflected in the long upper shadow. However, the bears are unable to sustain this downward momentum.
- Buyer Intervention: Buyers step in and aggressively push prices back up, nearly erasing the earlier losses. This strong buying pressure forms the long upper wick.
- Closing Price: The session closes near the opening price, resulting in a small real body. The small real body indicates a period of indecision as the market assesses the shift in sentiment.
Interpreting the Inverted Hammer
The Inverted Hammer signifies a potential shift in power from sellers to buyers. The long upper shadow demonstrates that sellers were unable to maintain control at higher prices, and the subsequent price recovery suggests a resurgence of buying interest.
Key Characteristics of an Inverted Hammer:
- Small Real Body: The real body is small and can be either bullish or bearish.
- Long Upper Shadow: The upper shadow is at least twice the length of the real body, indicating a significant price rejection from the highs.
- Little or No Lower Shadow: The lower shadow is very small or nonexistent, suggesting that the price found support near the opening price.
Trading Implications in the Indian Market
When encountering an Inverted Hammer pattern in the Indian stock market, traders should consider the following:
- Confirmation: Look for a subsequent bullish candlestick, such as a long green candle or a gap up, to confirm the reversal signal.
- Volume: A higher volume on the day of the Inverted Hammer indicates stronger buying pressure and increases the likelihood of a reversal.
- Support Levels: An Inverted Hammer near a support level strengthens the bullish signal, as it indicates that the buyers are defending a key price level.
Multiple Candlestick Patterns
1. Engulfing Patterns: A Dramatic Shift in Market Sentiment
Engulfing patterns are among the most visually striking and reliable candlestick patterns. They consist of two candlesticks, where the second candle completely engulfs the real body of the first candle, signifying a major shift in market sentiment and a potential trend reversal.
The Bullish Engulfing Pattern: A Turning of the Tides
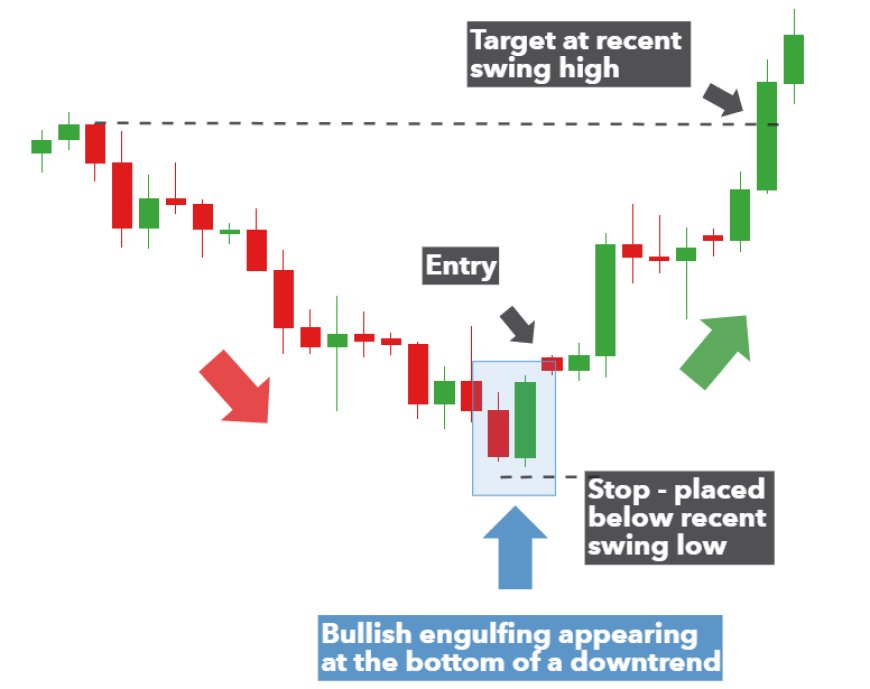
Imagine a tug-of-war between bears and bulls, where sellers have been consistently dominating, driving prices lower. Suddenly, a powerful surge of buying activity emerges, symbolized by a large bullish candle that completely engulfs the previous bearish candle. This dramatic shift in power is the essence of the Bullish Engulfing pattern, a two-candlestick formation that often heralds a potential reversal from a downtrend to an uptrend.
Unveiling the Dynamics
-
Bearish Sentiment: The first candle is a small bearish candle, reflecting the ongoing selling pressure in the downtrend. It shows that sellers are still in control, albeit with diminishing strength.
-
Bullish Counterattack: The second candle is a long bullish candle that opens lower than the previous day's close but closes above the previous day's open. This engulfing action signifies a forceful entry of buyers into the market, overwhelming the sellers and pushing prices higher.
-
Shift in Sentiment: The bullish engulfing pattern indicates a significant shift in market sentiment. The buying pressure has not only absorbed the selling pressure but has also surpassed it, creating a positive momentum that could potentially lead to a trend reversal.
Psychological Implications
The Bullish Engulfing pattern holds psychological significance as well. It suggests that the bears are losing confidence, while the bulls are gaining strength and conviction. This change in sentiment can attract more buyers into the market, further fueling the upward movement.
Trading Opportunities in the Indian Market
For traders in the Indian stock market, the Bullish Engulfing pattern presents an attractive opportunity to enter long positions. When this pattern appears in a downtrend, it signals a potential turning point, and traders may consider buying the stock in anticipation of a price increase.
To maximize the potential of this pattern, traders often combine it with other technical indicators, such as:
- Support Levels: A Bullish Engulfing pattern near a support level is a stronger signal, as it indicates that the buyers are not only taking control but also defending a key price level.
- Volume: High volume accompanying the engulfing pattern confirms the strength of the buying pressure and increases the likelihood of a reversal.
- Momentum Indicators: Traders may use momentum indicators, such as the Relative Strength Index (RSI) or the Moving Average Convergence Divergence (MACD), to confirm the bullish momentum.
The Bearish Engulfing Pattern: A Change in the Winds

Imagine a market scenario where buyers have been in control, pushing prices higher and higher. Suddenly, a wave of selling pressure emerges, engulfing the recent bullish sentiment and hinting at a potential reversal. This dramatic shift is embodied in the Bearish Engulfing pattern, a two-candlestick formation that often signals a potential trend reversal from an uptrend to a downtrend.
Unveiling the Dynamics
-
Bullish Sentiment: The first candle is a small bullish candle, reflecting the ongoing buying pressure in the uptrend. It indicates that buyers are still optimistic, but their dominance may be waning.
-
Bearish Counterattack: The second candle is a long bearish candle that opens higher than the previous day's close but closes below the previous day's open. This engulfing action signifies a forceful entry of sellers into the market, overwhelming the buyers and pushing prices lower.
-
Shift in Sentiment: The bearish engulfing pattern indicates a significant shift in market sentiment. The selling pressure has not only absorbed the buying pressure but has also surpassed it, creating negative momentum that could potentially lead to a trend reversal.
Psychological Implications
The Bearish Engulfing pattern carries significant psychological implications. It suggests that the bulls are losing confidence and becoming hesitant, while the bears are gaining strength and conviction. This change in sentiment can attract more sellers into the market, further fueling the downward movement.
Trading Opportunities in the Indian Market
For traders in the Indian stock market, the Bearish Engulfing pattern serves as a warning sign to exit long positions or potentially enter short positions. When this pattern appears in an uptrend, it signals a potential turning point, and traders may consider selling their holdings or initiating short positions in anticipation of a price decline.
To enhance the effectiveness of this pattern, traders often combine it with other technical indicators, such as:
- Resistance Levels: A Bearish Engulfing pattern near a resistance level is a stronger signal, as it indicates that the sellers are not only taking control but also facing strong opposition from buyers at that level.
- Volume: High volume accompanying the engulfing pattern confirms the strength of the selling pressure and increases the likelihood of a reversal.
- Momentum Indicators: Traders may use momentum indicators, such as the Relative Strength Index (RSI) or the Moving Average Convergence Divergence (MACD), to confirm the bearish momentum.
2. Harami: The Whispering Reversal
The Harami, a Japanese word meaning "pregnant," is a two-candlestick pattern that signifies a potential shift in momentum or a trend reversal. Unlike the dramatic Engulfing pattern, the Harami is more subtle, with the second candle being smaller and contained within the real body of the first candle.
The Bullish Harami: A Whisper of Change in the Downtrend

The Bullish Harami is like a subtle whisper in a noisy market, hinting at a possible change in the prevailing trend. This two-candlestick pattern emerges within a downtrend and consists of a large bearish candle (the "mother") followed by a smaller bullish candle (the "baby") that is entirely contained within the real body of the mother candle.
Unveiling the Dynamics of the Bullish Harami
- Bearish Dominance: The first candle, a long bearish candle, reflects the ongoing selling pressure in the downtrend. It signifies that sellers are still in control, pushing prices lower.
- Hesitation and Consolidation: The second candle, a small bullish candle, indicates a pause in the downward momentum. The buyers are stepping in, but their strength is not yet enough to completely reverse the trend. This small candle represents a period of consolidation and indecision as the market assesses the situation.
- Potential Shift in Sentiment: The Bullish Harami signals a potential shift in market sentiment. The fact that buyers are able to push prices higher, even within the range of the previous bearish candle, suggests that the selling pressure may be weakening. This could be the first sign of a potential trend reversal.
Psychological Implications
The Bullish Harami carries psychological significance. It indicates that the bears may be losing their grip on the market, and some traders are starting to doubt the continuation of the downtrend. This hesitation among sellers can create an opportunity for buyers to step in and take control.
Trading Opportunities in the Indian Market
For traders in the Indian stock market, the Bullish Harami pattern can be a valuable tool for identifying potential entry points for long positions. However, it's important to exercise caution and wait for confirmation before acting on this pattern.
Here's how you can incorporate the Bullish Harami into your trading strategy:
- Confirmation: Look for subsequent bullish candlesticks, such as a long green candle or a gap up, to confirm the reversal signal. You can also use other technical indicators like moving averages or oscillators to validate the bullish momentum.
- Entry Point: If the reversal is confirmed, consider entering a long position with a target price based on your analysis of support and resistance levels.
- Volume: A Bullish Harami with high volume is generally considered more reliable than one with low volume.
The Bearish Harami: A Cloud of Doubt in the Uptrend

The Bearish Harami, with its subtle yet significant formation, casts a shadow of doubt on the continuation of an uptrend. This two-candlestick pattern appears within an uptrend and consists of a long bullish candle (the "mother") followed by a smaller bearish candle (the "baby") that is entirely contained within the real body of the mother candle.
Unveiling the Dynamics of the Bearish Harami:
-
Bullish Dominance: The first candle, a long bullish candle, reflects the ongoing buying pressure in the uptrend. It indicates that buyers are in control, driving prices higher with enthusiasm.
-
Hesitation and Consolidation: The second candle, a small bearish candle, signifies a pause in the upward momentum. While sellers are attempting to push prices lower, their strength is not yet sufficient to overcome the prevailing bullish sentiment. This small candle represents a period of consolidation and indecision as the market assesses the situation.
-
Potential Shift in Sentiment: The Bearish Harami signals a potential shift in market sentiment. The fact that sellers are able to push prices lower, even within the range of the previous bullish candle, suggests that the buying pressure may be weakening. This could be the first sign of a potential trend reversal.
Psychological Implications:
The Bearish Harami carries psychological significance. It indicates that the bulls may be losing confidence and becoming hesitant, while the bears are starting to sense an opportunity. This shift in sentiment can create a self-fulfilling prophecy, as more traders may start to sell, further driving prices lower.
Trading Opportunities in the Indian Market:
For traders in the Indian stock market, the Bearish Harami pattern can be a valuable tool for identifying potential exit points for long positions or entry points for short positions. However, it's important to exercise caution and wait for confirmation before acting on this pattern.
Here's how you can incorporate the Bearish Harami into your trading strategy:
- Confirmation: Look for subsequent bearish candlesticks, such as a long red candle or a gap down, to confirm the reversal signal. You can also use other technical indicators like moving averages or oscillators to validate the bearish momentum.
- Exit Point/Entry Point: If the reversal is confirmed, consider exiting your long positions or entering short positions with a target price based on your analysis of support and resistance levels.
- Volume: A Bearish Harami with high volume is generally considered more reliable than one with low volume.
3. Morning Star and Evening Star: Celestial Guides for Reversals
The Morning Star and Evening Star patterns are among the most captivating and reliable three-candlestick formations in technical analysis. They offer valuable clues about potential trend reversals, with the Morning Star signaling a bullish reversal and the Evening Star indicating a bearish reversal.
The Morning Star: Dawn of a New Uptrend
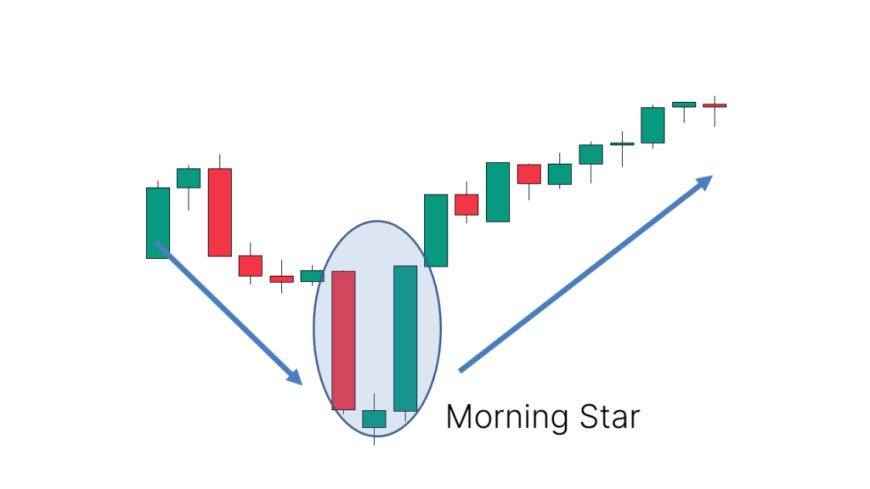
The Morning Star pattern typically emerges in a downtrend and consists of three distinct candlesticks:
-
Long Bearish Candle: The first candle is a long red or black candle, reflecting the ongoing selling pressure in the downtrend. It signifies that the bears are still in control, pushing prices lower.
-
Small-Bodied Candle (the Star): The second candle is a small-bodied candle, either bullish or bearish, that gaps down from the previous candle. This star represents a period of indecision and potential exhaustion among the sellers. The market is pausing for breath before potentially changing direction.
-
Long Bullish Candle: The third candle is a long green or white candle that gaps up from the star and closes well above the midpoint of the first candle. This powerful bullish candle indicates a resurgence of buying pressure and a potential reversal of the downtrend.
Interpreting the Morning Star
The Morning Star pattern suggests that the selling pressure is weakening, and buyers are starting to regain control. The small-bodied star candle indicates a pause in the downtrend, and the subsequent long bullish candle confirms the shift in sentiment towards buying.
Key factors that strengthen the Morning Star signal:
a) Gaps:
- Gap Down (Star): The star candle gaps down from the first bearish candle, indicating a potential exhaustion of the downtrend. This gap signifies a decrease in selling pressure and creates a window of opportunity for buyers to step in.
- Gap Up (Third Candle): The third bullish candle gaps up from the star, signaling a strong surge in buying pressure. This gap confirms the bullish reversal and adds to the strength of the signal.
b) Volume:
- Increasing Volume on the Third Candle: The third bullish candle should ideally be accompanied by increasing trading volume. This indicates a strong influx of buyers entering the market, confirming the bullish sentiment and increasing the likelihood of a reversal.
- Decreasing Volume on the First Candle: The volume on the first bearish candle should be higher than the volume on the star candle. This suggests that the selling pressure is weakening as the downtrend loses momentum.
c) Price Action:
- Size of the Real Bodies: A long first bearish candle followed by a small-bodied star and a long bullish candle typically indicates a stronger Morning Star pattern. The larger the real bodies, the more significant the change in sentiment.
- Closing Price of the Third Candle: The higher the third bullish candle closes relative to the first bearish candle, the stronger the reversal signal. Ideally, the third candle should close well above the midpoint of the first candle's real body.
d) Confirmation from Other Indicators:
- Support and Resistance: If the Morning Star pattern forms near a support level, it further strengthens the bullish signal. The support level acts as a floor for the price, and the bounce from this level can trigger a reversal.
The Evening Star: Dusk of the Uptrend

The Evening Star pattern is the bearish counterpart of the Morning Star and typically appears in an uptrend. It consists of three candlesticks that mirror the Morning Star formation but in reverse order:
- Long Bullish Candle: The first candle is a long green or white candle, reflecting the ongoing buying pressure in the uptrend.
- Small-Bodied Candle (the Star): The second candle is a small-bodied candle that gaps up from the previous candle.
- Long Bearish Candle: The third candle is a long red or black candle that gaps down from the star and closes well below the midpoint of the first candle.
Interpreting the Evening Star
The Evening Star pattern suggests that the buying pressure is weakening, and sellers are starting to gain control. The small-bodied star candle indicates a pause in the uptrend, and the subsequent long bearish candle confirms the shift in sentiment towards selling.
Key factors that strengthen the Evening Star signal:
a) Gaps:
- Gap Up (Star): The star candle gaps up from the first bullish candle, indicating an initial continuation of the uptrend. This gap creates a sense of exuberance and over-optimism, which can be a precursor to a reversal.
- Gap Down (Third Candle): The third bearish candle gaps down from the star, signaling a significant shift in sentiment. This gap confirms the bearish reversal and adds to the strength of the signal.
b) Volume:
- High Volume on the Third Candle: The third bearish candle should be accompanied by high trading volume. This indicates that sellers are entering the market aggressively, confirming the bearish sentiment and increasing the likelihood of a reversal.
- Decreasing Volume on the First Two Candles: Ideally, the volume on the first two candles (bullish candle and star) should be lower than the volume on the third bearish candle. This suggests that the buying pressure is weakening, while the selling pressure is intensifying.
c) Price Action:
- Size of the Real Bodies: A long first bullish candle followed by a small-bodied star and a long bearish candle typically indicates a stronger Evening Star pattern. The larger the real bodies, the more significant the change in sentiment.
- Closing Price of the Third Candle: The lower the third bearish candle closes relative to the first bullish candle, the stronger the reversal signal. Ideally, the third candle should close well below the midpoint of the first candle's real body.
d) Confirmation from Other Indicators:
- Support and Resistance: If the Evening Star pattern forms near a resistance level, it further strengthens the bearish signal. The resistance level acts as a barrier for the price, and the failure to break above it can trigger a reversal.
4. Piercing Line and Dark Cloud Cover: Dueling Patterns of Reversal
The Piercing Line and Dark Cloud Cover are two-candlestick patterns that reveal a captivating interplay between buyers and sellers during potential trend reversals. While they appear in opposite market contexts, they share a common characteristic: the second candle gaps down but closes above the midpoint of the first candle's real body. This dynamic interplay hints at a potential shift in momentum and the emergence of a new trend.
Piercing Line: A Glimmer of Hope in the Downtrend
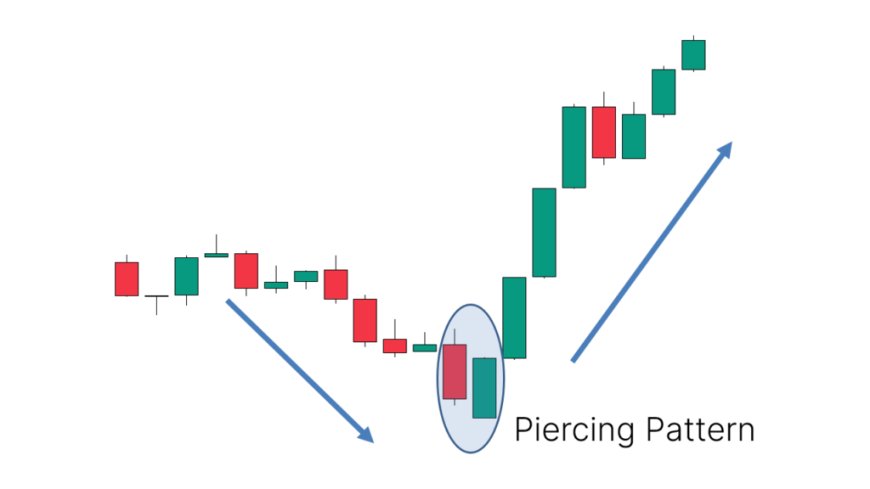
The Piercing Line pattern emerges within a downtrend and serves as a glimmer of hope for bullish traders. It consists of two candlesticks:
-
Long Bearish Candle: The first candle is a long red or black candle, reflecting the ongoing selling pressure in the downtrend. It signifies that the bears are in control, pushing prices lower.
-
Long Bullish Candle: The second candle is a long green or white candle that gaps down at the open but closes above the midpoint of the previous bearish candle. This strong bullish candle indicates a resurgence of buying pressure and a potential reversal of the downtrend.
Interpreting the Piercing Line:
The Piercing Line pattern suggests that the selling pressure is weakening, and buyers are starting to regain control. The gap down at the open may initially create fear among traders, but the subsequent strong bullish close indicates a shift in sentiment towards buying.
Key factors that strengthen the Piercing Line signal:
- Gap Down: The gap down at the open creates a sense of panic among sellers, which can be a catalyst for a reversal.
- Closing Price: The higher the second bullish candle closes above the midpoint of the first candle, the stronger the reversal signal.
- Volume: High volume on the second bullish candle confirms the buying pressure and increases the likelihood of a reversal.
Dark Cloud Cover: A Shadow Cast on the Uptrend

The Dark Cloud Cover pattern is the bearish counterpart of the Piercing Line and typically appears in an uptrend. It consists of two candlesticks:
- Long Bullish Candle: The first candle is a long green or white candle, reflecting the ongoing buying pressure in the uptrend.
- Long Bearish Candle: The second candle is a long red or black candle that gaps down at the open but closes above the midpoint of the previous bullish candle. This bearish candle indicates a resurgence of selling pressure and a potential reversal of the uptrend.
Interpreting the Dark Cloud Cover:
The Dark Cloud Cover pattern suggests that the buying pressure is weakening, and sellers are starting to gain control. The gap down at the open may initially create excitement among buyers, but the subsequent bearish close indicates a shift in sentiment towards selling.
Key factors that strengthen the Dark Cloud Cover signal:
- Gap Down: The gap down at the open creates a sense of hesitation among buyers, which can be a precursor to a reversal.
- Closing Price: The lower the second bearish candle closes within the real body of the first candle, the stronger the reversal signal.
- Volume: High volume on the second bearish candle confirms the selling pressure and increases the likelihood of a reversal.
7. Abandoned Baby: A Sudden Shift in Market Sentiment
The Abandoned Baby, a rare and visually distinct three-candlestick pattern, signifies a dramatic shift in market sentiment and a potential trend reversal. It derives its name from the "Doji" candle (the baby) that is "abandoned" by the preceding and following candlesticks (the parents) due to price gaps.

Bullish Abandoned Baby: A Ray of Hope in the Downtrend
The Bullish Abandoned Baby pattern typically emerges in a downtrend and consists of three candles:
-
Long Bearish Candle (First Parent): The first candle is a long red or black candle, reflecting the ongoing selling pressure in the downtrend. It indicates that the bears are in control, driving prices lower.
-
Doji (The Abandoned Baby): The second candle is a Doji that gaps down from the first candle. This Doji, with its small or nonexistent real body, signifies indecision and a potential exhaustion of the selling pressure.
-
Long Bullish Candle (Second Parent): The third candle is a long green or white candle that gaps up from the Doji and closes well above the midpoint of the first candle's real body. This strong bullish candle indicates a resurgence of buying pressure and a potential reversal of the downtrend.
Interpreting the Bullish Abandoned Baby
The Bullish Abandoned Baby pattern suggests a sudden and powerful shift in market sentiment. The Doji, representing indecision, acts as a pivot point, and the subsequent bullish candle confirms the reversal. This pattern indicates that the selling pressure has been exhausted, and buyers have taken control, driving prices higher.
Bearish Abandoned Baby: A Red Flag in the Uptrend
The Bearish Abandoned Baby pattern is the opposite of the Bullish Abandoned Baby and typically appears in an uptrend. It consists of three candles:
- Long Bullish Candle (First Parent): The first candle is a long green or white candle, reflecting the ongoing buying pressure in the uptrend.
- Doji (The Abandoned Baby): The second candle is a Doji that gaps up from the first candle.
- Long Bearish Candle (Second Parent): The third candle is a long red or black candle that gaps down from the Doji and closes well below the midpoint of the first candle's real body.
Interpreting the Bearish Abandoned Baby
The Bearish Abandoned Baby pattern indicates a sudden change in sentiment from bullish to bearish. The Doji acts as a turning point, and the subsequent bearish candle confirms the reversal. This pattern suggests that the buying pressure has weakened, and sellers have taken control, driving prices lower.
8. Rising and Falling Three Methods: The Dance of Continuation
The Rising and Falling Three Methods are captivating candlestick patterns that reveal the ongoing struggle between buyers and sellers in a trending market. These five-candlestick formations signify a temporary pause or retracement within a trend, followed by a decisive continuation of the original direction.
Rising Three Methods: A Bullish Respite

The Rising Three Methods pattern typically emerges in an uptrend. It consists of five candlesticks:
- Long Bullish Candle: The first candle is a long green or white candle, signifying strong buying pressure and the continuation of the uptrend.
- Three Small Bearish Candles: The next three candles are smaller bearish candles that retrace a portion of the gains from the first candle. These candles represent a temporary pullback or consolidation within the uptrend.
- Long Bullish Candle: The fifth and final candle is another long bullish candle that breaks above the high of the first candle, confirming the continuation of the uptrend.
Interpreting the Rising Three Methods:
The Rising Three Methods pattern indicates that the uptrend is taking a breather, allowing for a minor correction. However, the bulls remain in control, and the subsequent long bullish candle reaffirms the upward momentum. This pattern often occurs when traders take profits after a significant price increase, leading to a temporary pullback before the uptrend resumes.
Falling Three Methods: A Bearish Retracement

The Falling Three Methods pattern is the bearish counterpart of the Rising Three Methods and typically appears in a downtrend. It consists of five candlesticks:
- Long Bearish Candle: The first candle is a long red or black candle, signifying strong selling pressure and the continuation of the downtrend.
- Three Small Bullish Candles: The next three candles are smaller bullish candles that retrace a portion of the losses from the first candle. These candles represent a temporary bounce or consolidation within the downtrend.
- Long Bearish Candle: The fifth and final candle is another long bearish candle that breaks below the low of the first candle, confirming the continuation of the downtrend.
Interpreting the Falling Three Methods:
The Falling Three Methods pattern indicates that the downtrend is pausing for a minor bounce. However, the bears remain in control, and the subsequent long bearish candle reaffirms the downward momentum. This pattern often occurs when traders cover their short positions after a significant price decline, leading to a temporary bounce before the downtrend resumes.
What's Your Reaction?


